By far the most-read posts I have ever written are not about IUU fishing, licensing, transhipment or any of the topics I actually work on. They are the ones about mercury in tuna and where the fish was caught, the model of mercury distribution across the WCPO, and where the methylmercury in the ocean comes from in the first place. Almost a decade later, people still land on those pages. It still says something that more people worry about what tuna might do to them than about the legality of the catch or the working conditions of the crew that got it on board.
So when a paper on exactly that topic turns up on the agenda of the WCPFC Scientific Committee, which is meeting in Apia as I write this, I read it with more than professional interest. WCPFC-SC22-2026-RP-P35b-03, "Methylmercury and other pollutants studies in tunas", is presented by Anaïs Médieu, Valérie Allain, David Point, Anne Lorrain and colleagues from IRD, SPC, Toulouse, Université Laval and IFREMER. It is essentially a stocktake of eleven years of work, and it closes several of the loops I left open in those earlier posts.
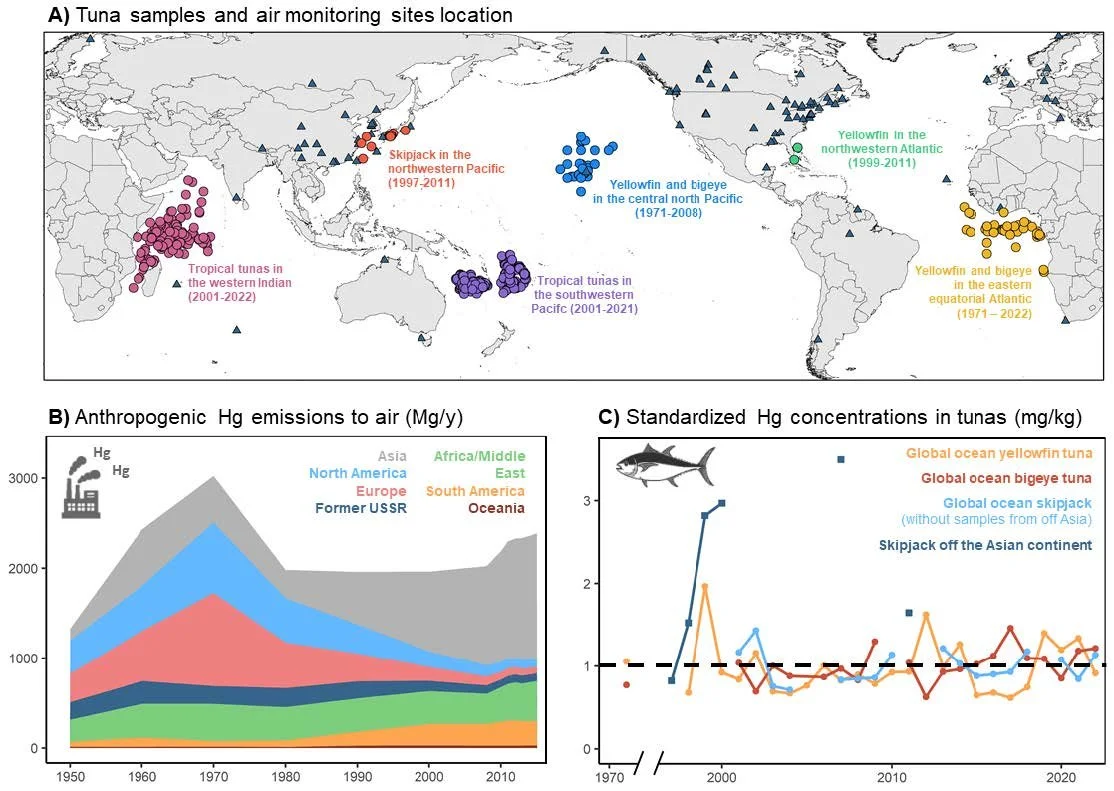
A) Spatial distribution of tropical tunas analysed for mercury (coloured circles) and atmospheric mercury level observation sites (blue triangles). B) Temporal anthropogenic mercury releases from 1950 to 2010 by world region, from Streets et al. (2019a, 2019b). C) Temporal variability of mercury concentrations (Hg, mg/g) in tropical tunas: yellowfin (orange), bigeye (red), and skipjack (blue), from Médieu et al. (2024).
The database our observers built
For me, the 1st substantial fact to highlight is not the numbers about mercury. It is where the numbers came from.
The team assembled over 5,700 total mercury measurements in muscle tissue: 1,422 bigeye, 2,467 yellowfin, 1,003 skipjack and 900 albacore, from the Pacific (3,551), Indian (1,218) and Atlantic (1,023) oceans. That is the largest global dataset of mercury ever compiled for tropical tunas and albacore. A large share of it is due to the WCPFC Pacific Marine Specimen Bank, which has quietly been accumulating tissue samples collected by onboard observers and port samplers across the region since 2001.
Think about what that means. An observer trip out of Majuro or Funafuti, taking a muscle plug, conserving it, and filling in a label, is a node in a global mercury monitoring network. Their work is now being used in the first evaluation of the effectiveness of the UNEP Minamata Convention. Pacific tuna, and the people who sample them, are measuring the performance of coal plants and gold mining operations on the other side of the planet. I do not think we say that often enough when we talk about the value of observer programmes, and we should, because it is one of the few arguments for observer coverage that has nothing to do with compliance.
Where the mercury is, and why
The spatial picture confirms and sharpens what I wrote about in 2019. Standardised mercury concentrations in yellowfin, bigeye and albacore are higher around New Caledonia and Fiji than near the equator. Skipjack levels are 1.5 to 2 times higher in the northwestern Pacific than in the east, and 4 to 5 times higher than in the western central Pacific.
The driver is the combination of two things: how deep the species forages, and the biogeochemistry of the particular bit of ocean it forages in. Methylmercury is not evenly spread through the water column. It is produced by microbes down where oxygen is low and organic matter is raining down, so its concentration climbs with depth. The team compared measured seawater methylmercury profiles from the surface to 600 m against mercury in the blood and muscle of four tuna species with known, contrasting foraging depths. The relationship is clean and positive. Skipjack stay shallow and stay low. Bigeye work the deep scattering layer and pick up the load that lives there.
That is the mechanism behind the pattern, and it is why "big fish = mercury" is only half the story. Size matters, because bioaccumulation is the key mechanism, but a bigeye and a skipjack of the same weight are not eating out of the same place.
The northwestern Pacific skipjack signal is different again, and worth flagging. There, the elevated levels are attributed to proximity to anthropogenic sources, primarily fossil fuel use in Asia, superimposed on natural biogeochemistry. So we are seeing both the ocean's own plumbing and the smokestacks in the same dataset.
Fifty years of stubborn numbers
The temporal result is the one I would put in front of any policy person. The team compiled the longest time series of tuna mercury ever assembled, 1971 to 2022, and compared it to estimated regional atmospheric mercury emissions.
Outside the northwestern Pacific, tuna mercury concentrations have been essentially stable for fifty years, even though anthropogenic emissions have been falling in several regions. In the northwest they rose about fourfold in the late 1990s, tracking the rise in Asian emissions.
Stability sounds like good news until you understand why it happens. It is ocean inertia. Mercury emitted decades and centuries ago is still working its way through the water, and the fish are integrating that legacy, not this year's flue gas. Using a mercury circulation model, the authors show that even if emissions were cut drastically tomorrow, it would take between 10 and 25 years before we could detect a decline in tuna populations.
That is a hard message for a treaty that has to demonstrate results. It is also the strongest possible argument for both aggressive emission cuts now and continuous long-term monitoring, because the only way to see the payoff is to keep measuring for a very long time. Which brings us back to the specimen bank.
Not all mercury is the same, and not all billfish are the same
Here is the finding that genuinely surprised me, and that has direct consequences for food safety advice in our region.
Consumption guidelines are written for methylmercury, the toxic organic form. But in practice, risk assessments are almost always based on total mercury, assuming that most of it is methylmercury anyway. For tunas, that assumption holds: methylmercury is 70 to 100 per cent of total mercury in tropical tunas and albacore.
The team then measured four billfish species from New Caledonia and the Indian Ocean. In swordfish and striped marlin, methylmercury is around 90 percent of the total, as expected. In blue marlin and black marlin, it is less than 15 per cent.
These fish have high total mercury levels, but most of it has been converted into something else. The evidence points to selenium-dependent detoxification in vivo, with inert mercury selenide nanoparticles as the end product, and selenoneine, a selenium compound abundant in the muscle of tunas and swordfish, as a likely precursor in that pathway.
The practical consequence is that lumping "billfish" into one dietary category, as health agencies routinely do, gets it wrong in both directions. On a methylmercury basis, adults and children can eat blue and black marlin more often than swordfish or striped marlin, which is the opposite of what a total mercury reading would suggest. If we are going to give advice to Pacific communities where these fish are food, not just an export product, we need to measure the right compound.
For the tunas caught off New Caledonia, the picture is reassuring and familiar: every skipjack sample was below 0.5 mg/kg, yellowfin was mostly low with a small tail above the stricter guidelines, and bigeye was the outlier, with most samples above 0.3 mg/kg and a third above the 1 mg/kg predatory fish guideline. Species and size, together, are what matter.
Plastics, persistent organic pollutants (POPs) and the other stuff we have no rules for
The paper also reports a smaller exploratory study of around 100 samples from New Caledonia and PNG, covering persistent organic pollutants (PCBs, PBDEs, organochlorine pesticides, and PFAS) and plastics.
POPs are present, suggesting atmospheric and oceanic transport, given that the sources are overwhelmingly in the Northern Hemisphere, but the levels are low compared with those in other oceans and currently pose no known health risk.
Plastic fragments or fibres above 2 mm were found in the stomachs of 6 of the 20 fish examined, mostly polypropylene and polyester. Plastic additives were detected in muscle tissue at levels comparable to fish sampled in Spain.
And here is the gap: there are no health standards for those additives. We can now measure things in tuna flesh for which no regulator anywhere has set a limit. That is not a reason to panic; it is a reason to build the baseline now, while levels are low, so that in twenty years we can say whether something changed.
On the other side of the ledger, skipjack and yellowfin from both areas remain a solid source of fatty acids, including omega-3. The benefit side of the equation has not moved.
What SC is asked to do
The asks are modest: note the findings, note the uncertainties around detoxification and selenium, note that these fish are nutritionally valuable, and support the ongoing activities of the Pacific Marine Specimen Bank as an accessible long-term repository.
That last one is the only one with teeth, and the paper ends with a sentence that should worry us: funding is being sought to continue the work.
A 25-year archive of tuna tissue, collected by our observers, now underpinning a global treaty's effectiveness evaluation, and its continuation depends on the next grant cycle. We spend a great deal of money in this region for geopolitical purposes. A fraction of that keeps an asset like this alive.
For those of us working on the traceability side, there is a bonus I flagged back in 2017 and still believe in. If mercury varies by origin and by species, then knowing where a fish was caught is not just a compliance requirement; it is information about the product. Our region has low-mercury fish. Being able to prove its source turns a paperwork obligation into an argument.
As always, my summary is no substitute for the original. Read the paper; the figures do a lot of the work, and the science is theirs, not mine. I'm just pleased that the samples came from our part of the world.