Two years ago I wrote about the framework we developed with Starboard and MIMRA to evaluate the impracticability exemption for high-seas transhipment in the WCPO. We called it a proof of concept, and said we fully expected practitioners to poke holes in it and help us refine it. Well, nobody poked very hard, the intersessional working group that was supposed to fix CMM 2009-06 was disestablished in 2024 with little to show for it, and the longliners kept meeting carriers on the high seas pretty much where they had before.
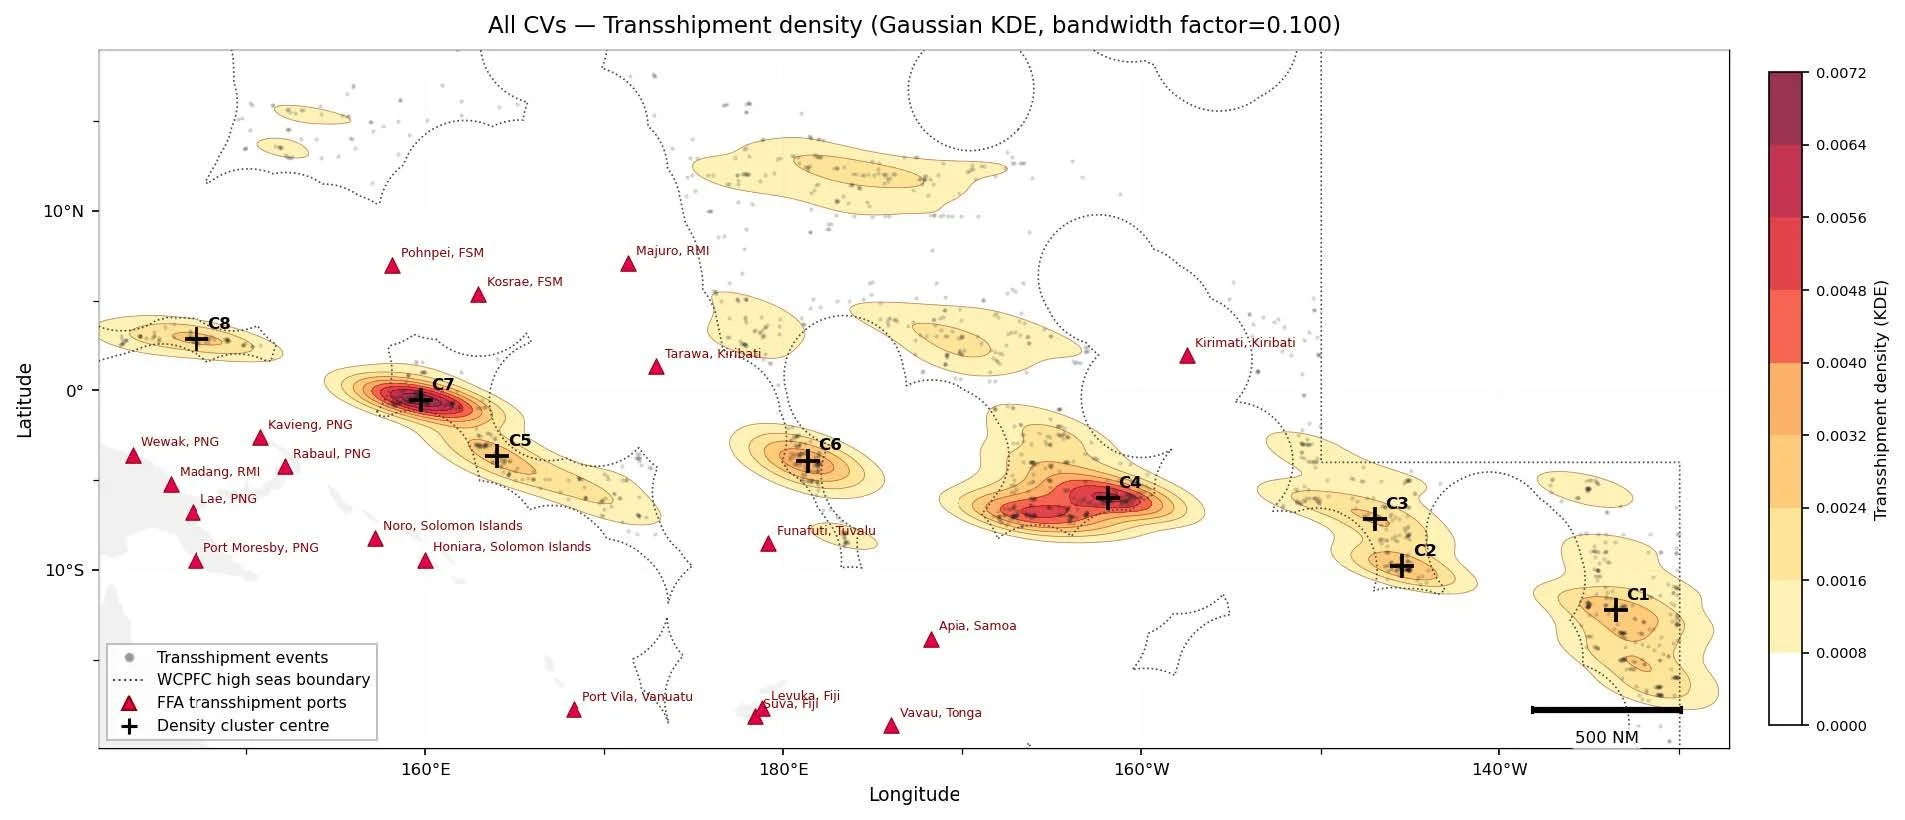
Hotspots of high-seas transhipment events recorded by six carrier vessels in the Convention Area, May 2020–March 2026 within 20°N/S (n = 1,644 events). Eight local density maxima (C1–C8) are identified and labelled. Red triangles indicate suitable regional transhipment ports.
So we went back to the data. The Marshall Islands submitted the follow-up to TCC22 in Pohnpei as WCPFC-TCC22-2026-DP06, High-seas transhipment in the Western and Central Pacific Ocean: fleet structure, vessel economics, and the impracticability assessment. MIMRA and Starboard Maritime Intelligence prepared it, with Moritz Lehmann, Beau Bigler, and me as authors, and Sharks Pacific and MIMRA commissioned it. Sara Nix and Sam McGovern at C4ADS ran the centroid distance calculations and pulled the ownership data, and Viv Fernandes kept us all coordinated.
The paper is long, so I split this into two posts. This first one is about the distances. The second one is about the economics, who owns what, and what the Commission should do about it.
A quick reminder of the problem
Under CMM 2009-06, transhipment at sea by anything other than purse seiners is prohibited unless the flag state determines that it is impracticable for its vessels to operate without it. The interim test has two limbs: in-port transhipment would cause significant economic hardship, and it would force a significant and substantial change to the vessel's historical mode of operation. Paragraph 37 required the Commission to adopt proper guidelines by 2012. It is 2026, and they still don't exist.
The test was written for vessels genuinely fishing far from any suitable port. In practice, it became the default justification for most high-seas transhipment in the region, determined by the flag state itself against no evidentiary standard. I have been going on about this for years, most recently on the due diligence that should happen before a transhipment at sea, and doesn't and on the awkward numbers in the WCPFC 2025 MCS reporting.
What is new this time
The 2024 study covered 27 carriers from May 2020 to November 2023 and only used events of five hours or longer. This time we went narrower and deeper: six carriers, 1,644 events and 486 fishing vessels, from May 2020 to March 2026, on the high seas within 20 degrees of the equator.
The six were chosen for event volume and to cover the flags that do most of this work: DONG HRONG 899 (Chinese Taipei), PINGTAIRONGLENG2 (China), SEISHIN and MV BADARO (South Korea), and FULL KUO SHIN and TAIHO MARU (Panama, with beneficial ownership in Chinese Taipei and Japan). Five of them were among the eight central carriers we identified in 2024.
We also added some new layers. We kept the short encounters (under five hours) and stratified by duration instead of excluding them. We built a network analysis with beneficial ownership from S&P Global's MIRS. We compared carrier size with transhipment duration, tested whether fuel prices affect where vessels tranship, and measured actual track lengths for six fishing vessels and one carrier to check the centroid-based metric against real miles sailed.
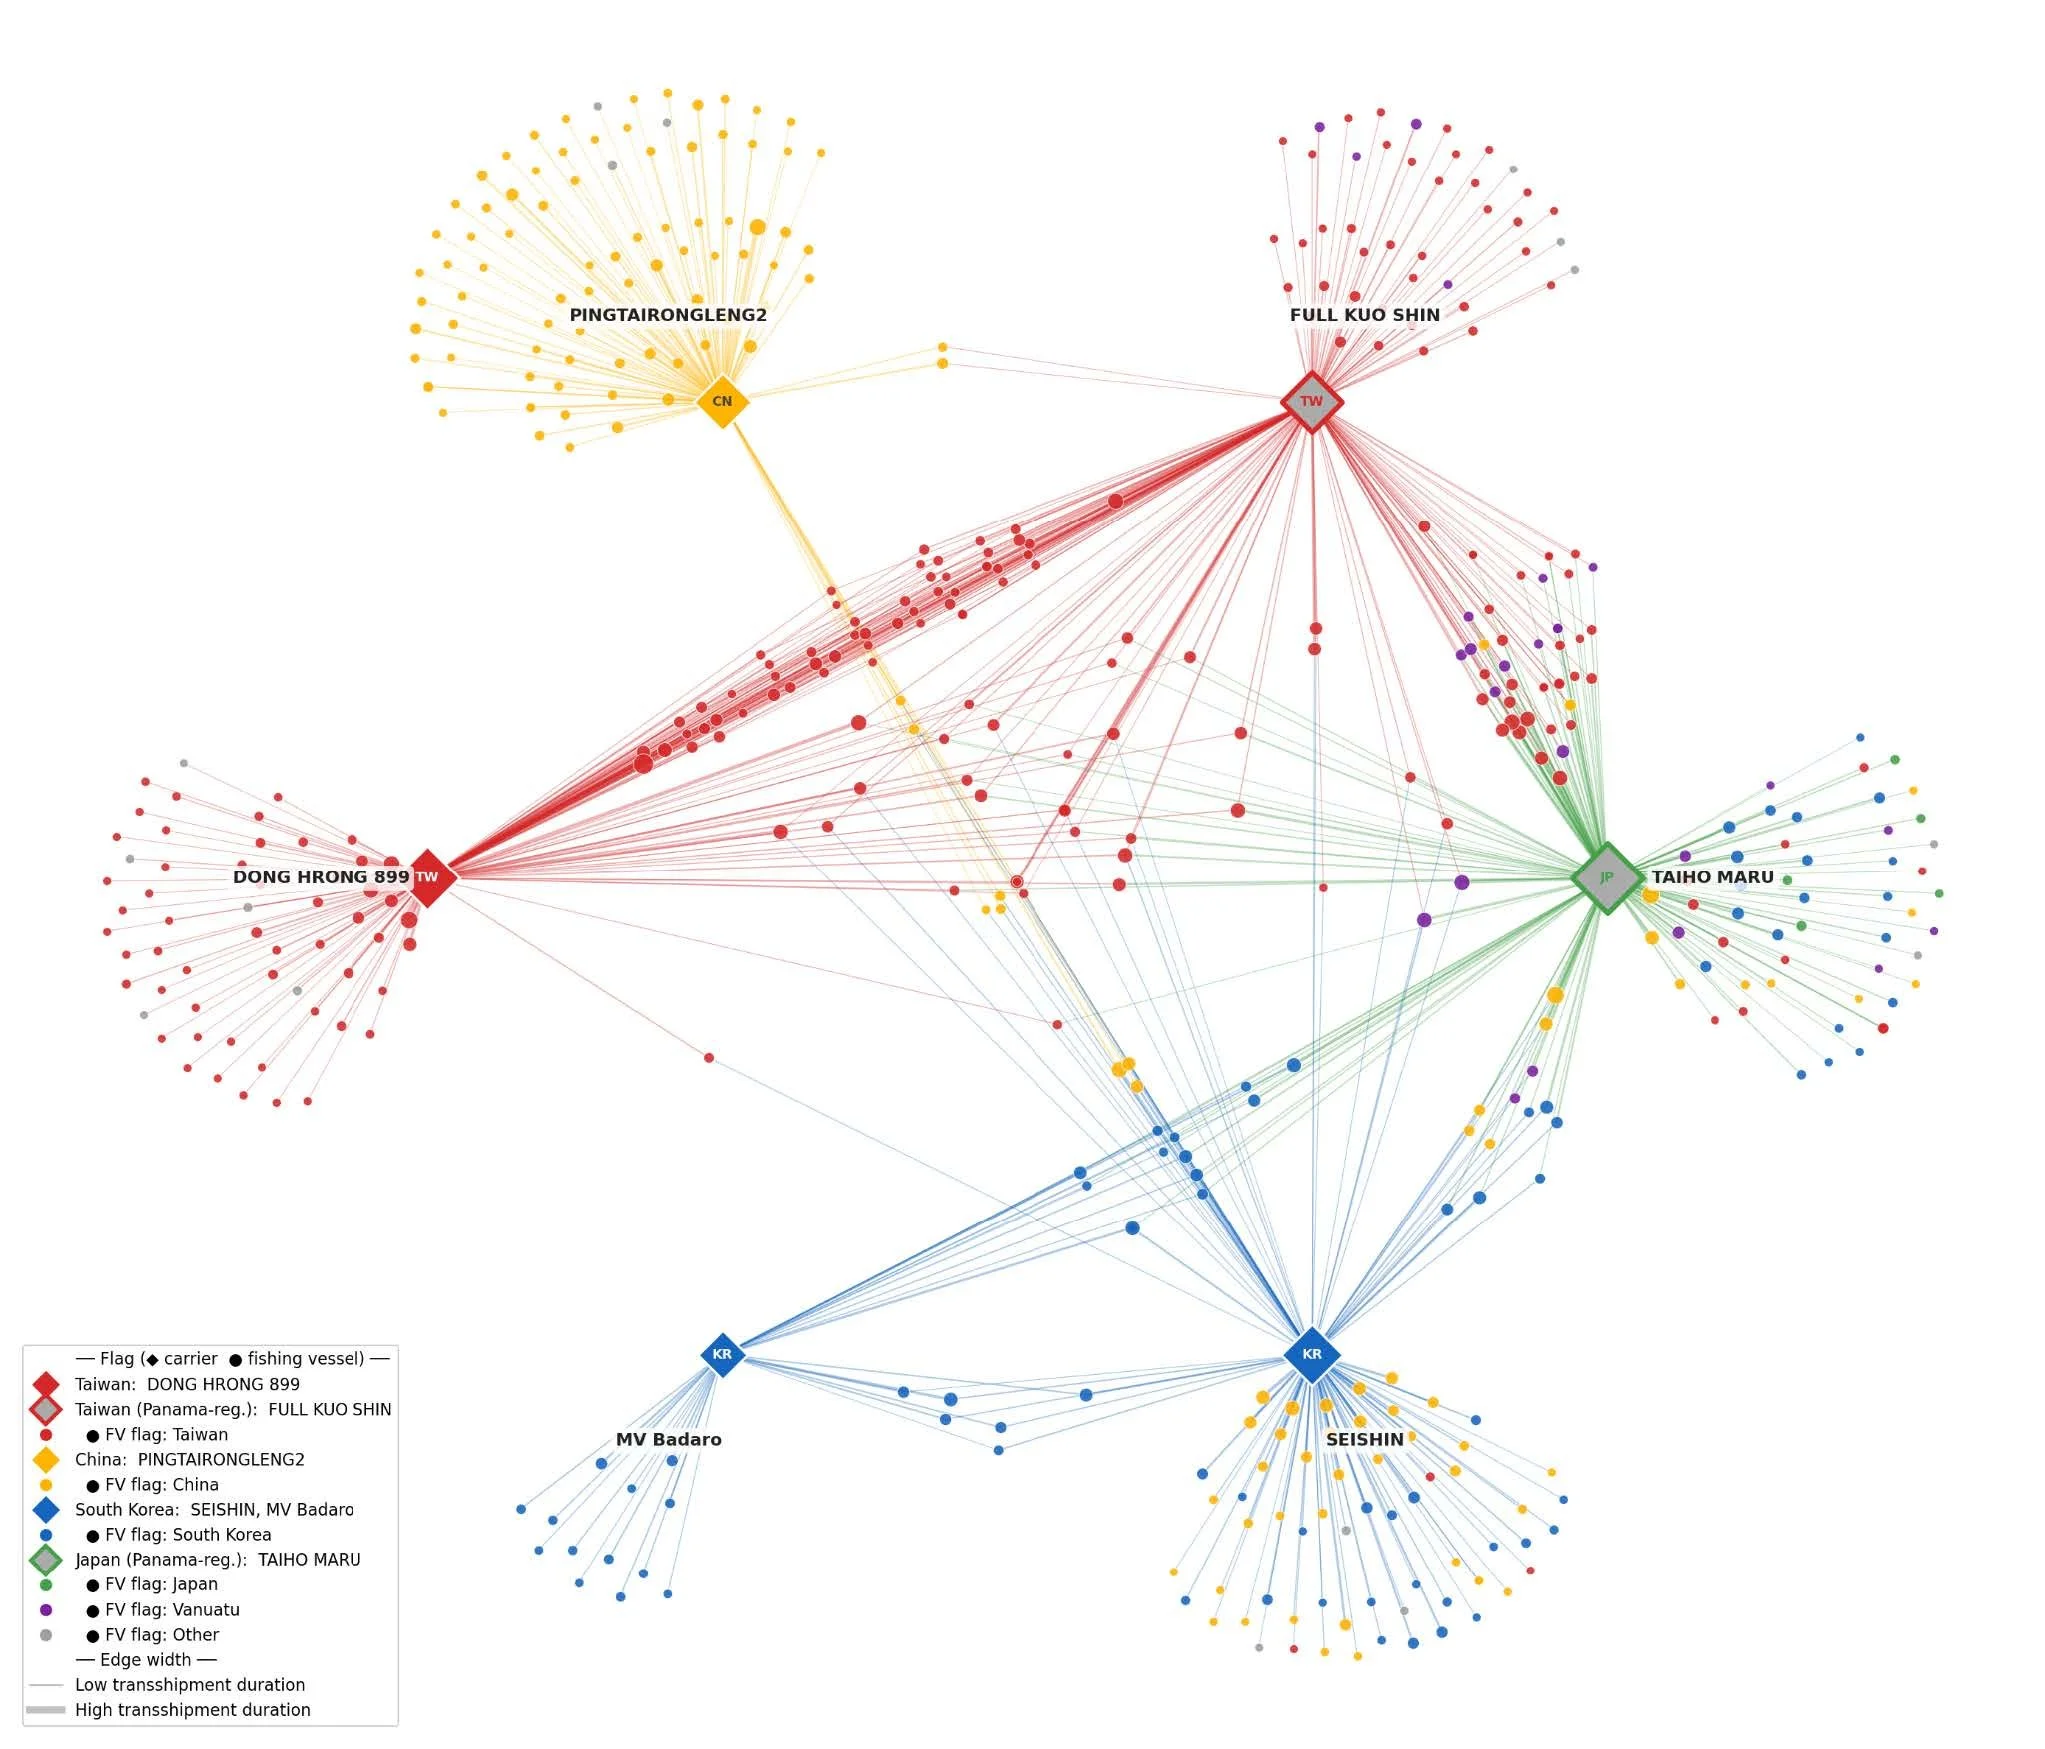
High-seas transhipment network in the WCPFC Convention Area (May 2020 – March 2026), showing carrier vessels (diamonds) and fishing vessels (circles). Node size is proportional to total cumulative transhipment duration. Edge width is proportional to cumulative transhipment duration per carrier–fishing vessel pair, and colour identifies theflag state
The distance test
The logic is simple. For each event, we find the fishing centroid, the weighted centre of all fishing since the vessel's previous transhipment or port visit. We then divide the distance from that centroid to the transhipment location by the distance to a suitable port.
The port distance is measured two ways: from the centroid to the nearest suitable port, and as the vessel's closest approach to any suitable port within two weeks either side of the event. We use whichever gives the higher ratio, so any port opportunity the vessel actually had, from the grounds or along its route, counts against the claim. A ratio below 1 means the carrier was closer than any port. A ratio above one means a port was at least as accessible as the spot the vessel chose.
The ratio could be calculated for 1,277 events:
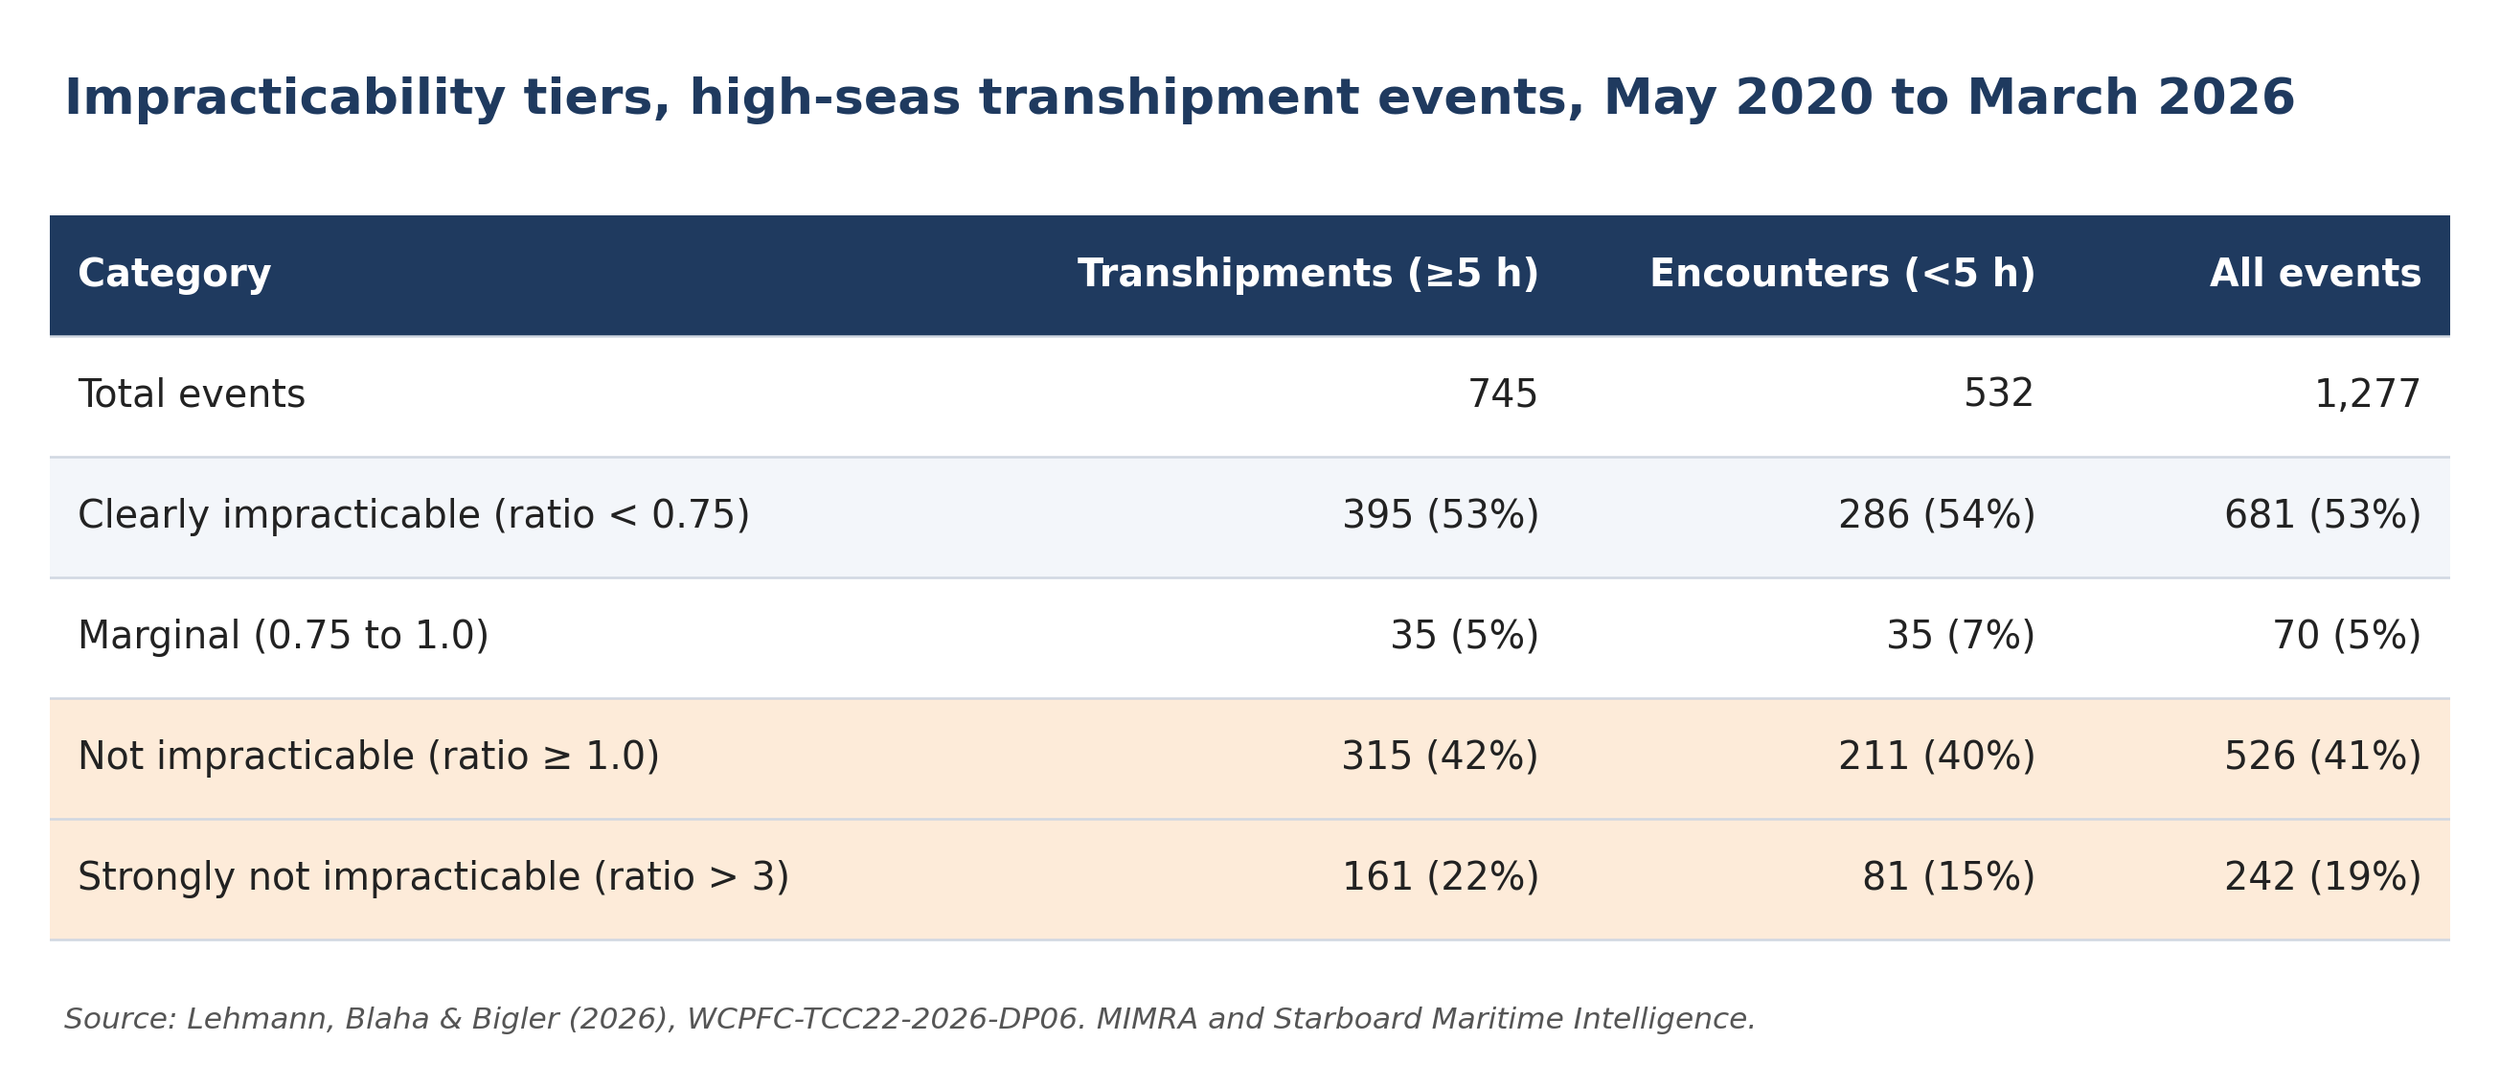
Summary of impracticability tier classification for all transhipment events and shorter encounters, based on the conservative ratio (the greater of the centroid-based and vessel-track-based port distance ratios). Clearly impracticable events have a ratio below 0.75, indicating the transhipment location was substantially closer to the fishing grounds than the nearest suitable port. Marginal events (ratio 0.75–1.0) fall within a zone of approximate equidistance where best-practice port use could reasonably be expected. Events with a ratio of 1.0 or above are classified as not impracticable, as a suitable port was at least as accessible as the transhipment location. Events with a conservative ratio above 3, where the transhipment location was more than three times further from the fishing grounds than the nearest suitable port, are classified as strongly not impracticable
So a bit over half the events look genuinely impracticable on distance. That is nothing, and it would be dishonest to pretend otherwise. But 41% are not, and in 242 events the vessel went more than three times as far to meet the carrier as it would have gone to reach a port. Those are the cases where economic hardship is hardest to argue with a straight face.
The result holds for every one of the six carriers, and it is almost identical for proper transhipments and for short encounters. It is not one rogue operator, one flag or one patch of ocean. SEISHIN stands out: the median ratio for its longer transhipments is 2.35, meaning the typical vessel meeting it travelled more than twice the distance it would have needed to reach a port.
Where it happens
The events cluster in eight hotspots, and they split neatly into two groups.
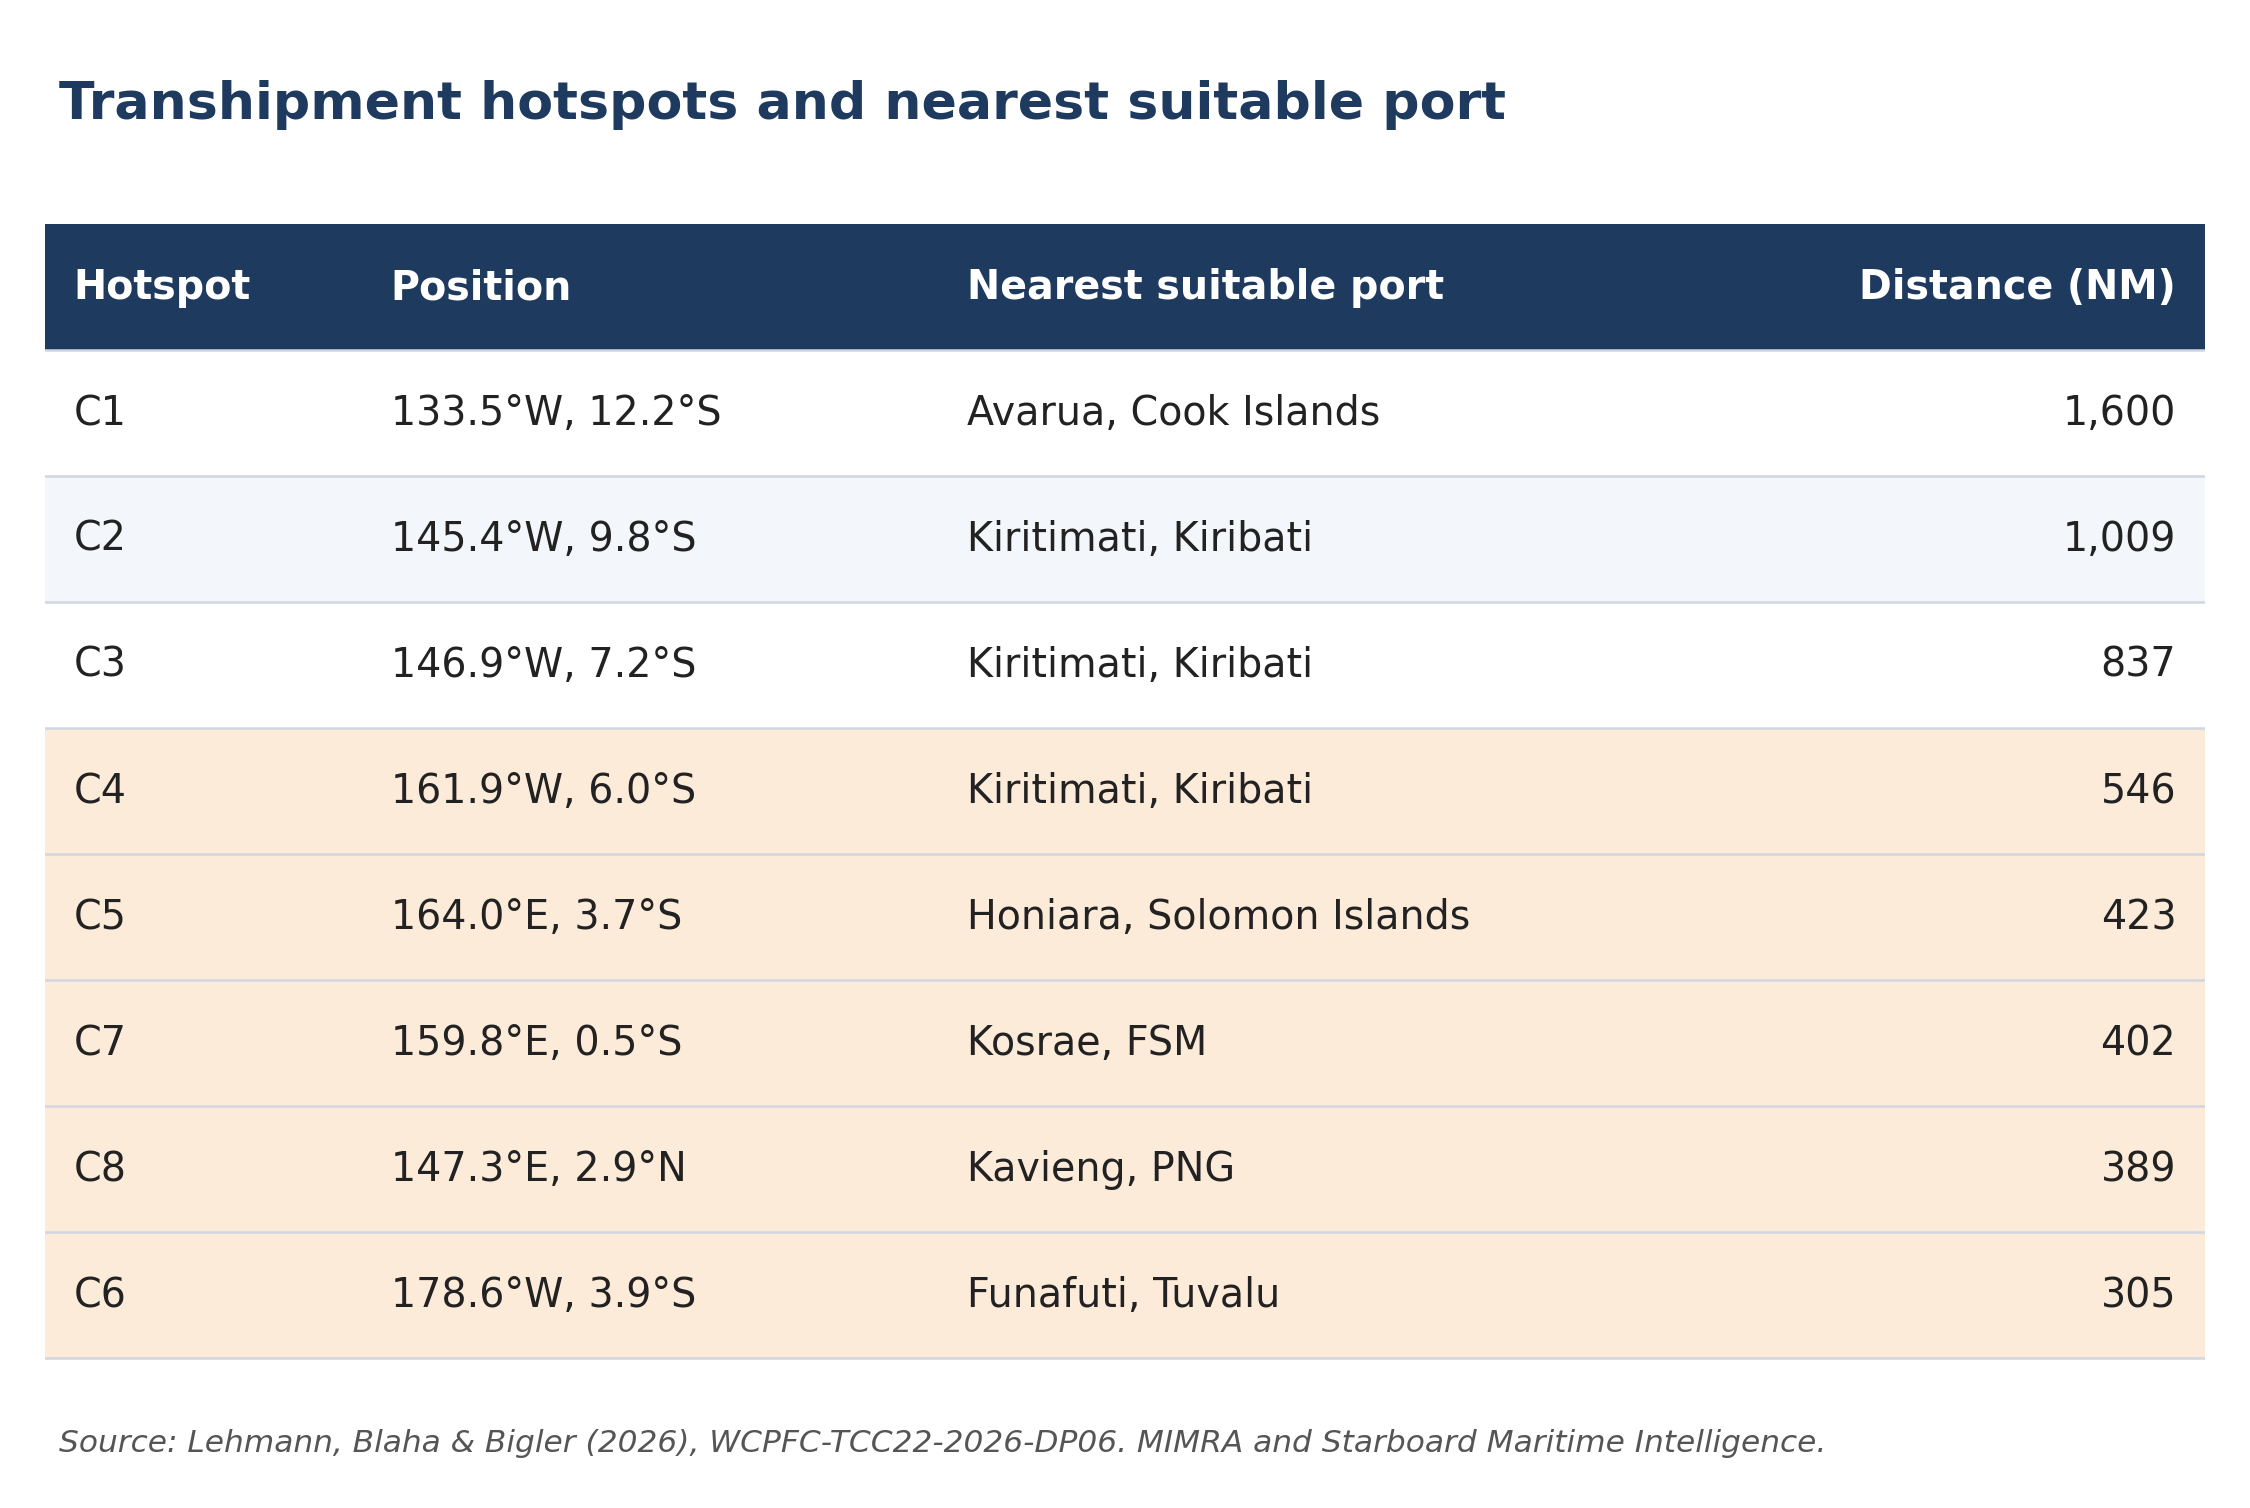
The three eastern ones, between 133 and 147 degrees west, sit 837 to 1,600 NM from the nearest port that can host a longline transhipment. There the exemption is defensible on its face, and that is the kind of fishing the test was written for. I have no problem saying so.
The other five are a different story. They lie within about 550 NM of Kiritimati, Honiara, Kosrae, Kavieng and Funafuti. Those ports, and the countries behind them, carry the cost of the practice: forgone charges, services never bought, and the monitoring and catch verification that a port call would have delivered to the region.
Counting the actual miles
The centroid ratio is a straight-line proxy. We chose it because it is cheap to compute, easy for an analyst to verify, and it survives the AIS gaps that plague fishing vessel records. To check it against reality, we picked six fishing vessels flagged to Chinese Taipei, South Korea, China, Japan and Vanuatu, chosen for lots of events and few AIS gaps, and measured 17 trips between transhipments.
The trips ran from 14 to 148 days and from 2,152 to 22,155 NM. And that is only the regional part, excluding the roughly 9,000 NM to and from home ports in Northeast Asia. Yet in the week before transshipping, nine of those 17 trips brought the vessel within a suitable port less than 10% of the trip's track length, and five within less than 5%.
One example: PANALOX505 sailed 15,143 NM before meeting MV BADARO in June 2023, and in the final week passed within 257 NM of Funafuti. When you have just sailed fifteen thousand miles, a 257-mile detour is not an economic hardship. The ports were not out of reach. They were passed.
Six years, no movement
The Convention requires members to encourage in-port transhipment, and CMM 2009-06 expects them to progressively reduce reliance on the exemption. If that were happening, the ratio would be drifting down over time. It isn't.
A linear trend on the log-transformed ratio across all 1,277 events gives a slope of +0.018 per year (p = 0.513, r² below 0.001). Quarterly medians are just as flat. The smoothed curve rises slightly around 2021 and 2022, then comes back down, but it shows no clear trend.
The only seasonal signal is March, the one month where the median event sits above the equidistant line. It shows up for SEISHIN, TAIHO MARU and MV BADARO alike, so it is not one carrier's quirk. We don't know the mechanism, and fleet-wide scheduling is the obvious suspect. If anyone who knows the trade better has an explanation, I'd be glad to hear it.
So: six years of tracks, same behaviour. The framework has not corrected itself, and nothing in the data suggests it will.
In Part 2 I'll get into why the economic hardship argument looks even thinner once you factor in how these fleets buy fuel, what the carriers burn, and who owns both ends of the transfer, and what we think the Commission should do.