The short version: across 1,277 high-seas events by six carriers between 2020 and 2026, 41% fail a simple test: whether a port was at least as close as the carrier, and that share hasn't budged in six years. This second part targets the two limbs of the impracticability test: economic hardship and the vessel's historical mode of operation.
If fuel mattered, fuel prices would show
The hardship argument, when it is made at all, is basically about fuel: the extra miles to a port multiplied by what fuel costs. If that logic actually drove decisions, vessels would tranship closer to their grounds when fuel is expensive and wander further when it is cheap.
We matched monthly Singapore MGO prices against the monthly median impracticability ratio over 65 months. The Spearman correlation was 0.111 (p = 0.377). At a one-month lag, it was 0.033; at two months, 0.003. We also tried three- and six-month rolling averages, dropped SEISHIN as the most influential carrier, and used raw distance to the transhipment location instead of the ratio. Nothing. And the direction, weak as it is, runs the wrong way round.
There is a fair caveat here, and we put it in the paper. Singapore MGO is probably not what these fleets pay. Most longliners bunker at sea, the flag states involved subsidise their distant-water fleets' fuel, and China is a documented buyer of discounted Russian crude. Fuel bought at sea, subsidised and outside anyone's tax base, does not track the Singapore spot price.
But notice which way that cuts. If these vessels pay less than the benchmark, the cost gap between meeting a carrier and steaming to a port is narrower than any market-rate calculation suggests. That weakens the hardship argument; it does not rescue it. Which is why one of our recommendations is that anyone claiming hardship should disclose actual fuel costs and the government support behind them.
The carrier's bill nobody counts
The test only looks at the longliner. But a high-seas transhipment needs a carrier out there too, and that carrier is not idling for free, nor cheap to run.
Alongside a longliner at sea, the carrier holds its heading against wind and swell on the main engine, while cranes, hydraulics, generators and refrigeration all keep running. Roughly, half the fuel goes to position control and half to auxiliaries. For MV BADARO, with a 4,175 kW main engine, we estimate around 4 t a day for positioning alone, rising to 6 to 8 t a day with refrigeration and hydraulics. At August 2026 VLSFO prices, that is about US$5,000 to US$6,800 a day. At anchor in a port, the main engine is off.
We then took one TAIHO MARU deployment apart in detail. It left Kaohsiung on 9 September 2025, spent 50 days at sea doing 42 likely transhipments with 30 fishing vessels (plus four inferred ones), called at Majuro for one hour and 39 minutes, and arrived in Shimizu on 8 November.
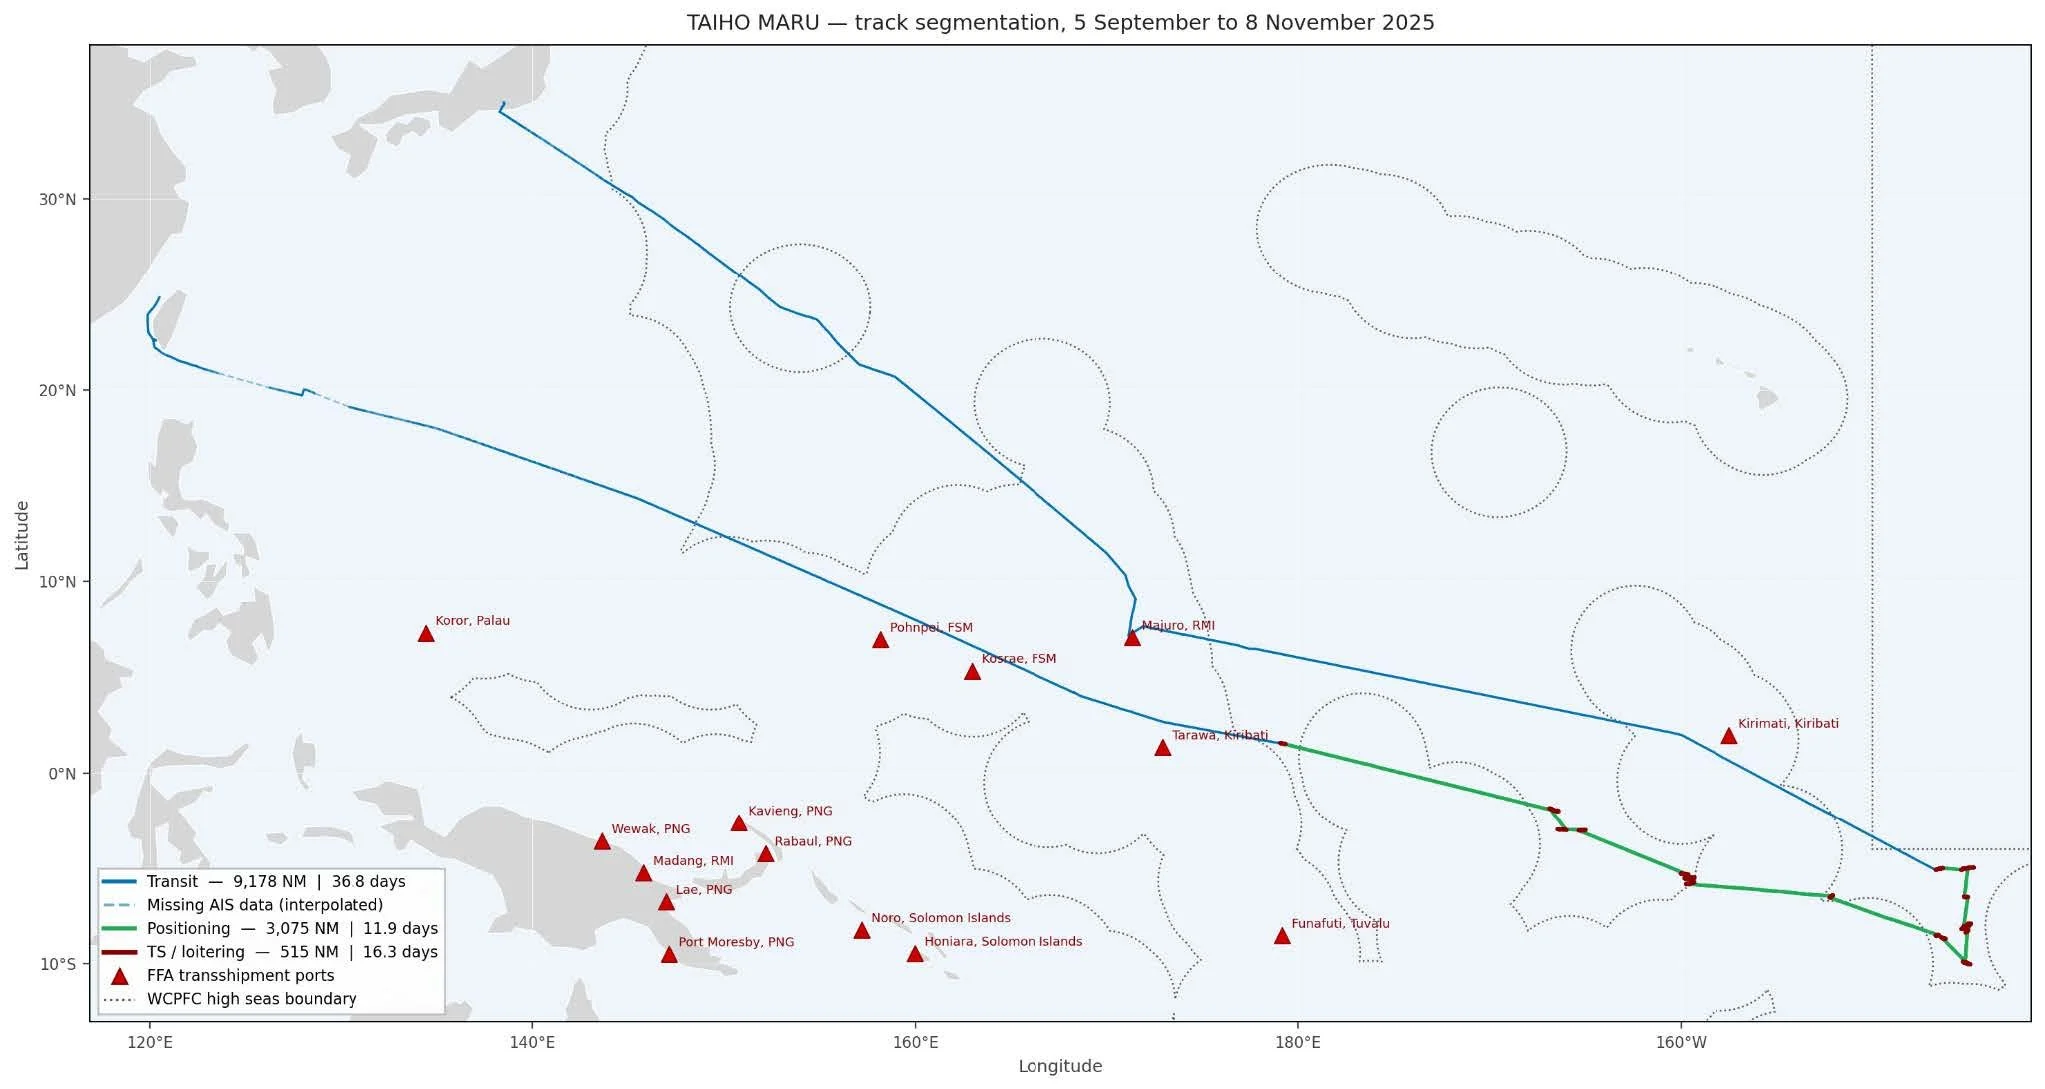
TAIHO MARU vessel track, 5 September to 8 November 2025, segmented by activity. Blue: transit to and from northeast Asia. Green: positioning within the transhipment operating window (speed > 3 knots), including repositioning between transhipment hotspots. Dark red: TS/loitering (speed ≤ 3 knots). Dashed segments indicate AIS reception gaps interpolated as straight lines. Red triangles indicate FFA-designated transhipment ports. The dotted line marks the WCPFC high seas boundary.
The positioning and transhipment work amounts to roughly 3,590 NM of equivalent steaming under main engine. A direct route from Kaohsiung via Tarawa and Kiritimati to Shimizu is 9,165 NM, within 13 NM of the transit it actually sailed. Calling at those two Kiribati ports instead would have kept the transit essentially unchanged and cut total fuel by around 28%.
I find it hard not to smile at the fact that the vessel already stops in Majuro on the way home to drop the IATTC observer. Just not long enough to do anything that a port call is actually for.
The test, as written, ignores all of this because it applies only to the fishing vessel. That makes some sense when carrier and longliner belong to different businesses. It makes much less sense when they belong to the same one, which brings me to the network.
Not geography, commerce
Carrier-and-fishing-vessel relationships follow national and commercial lines. DONG HRONG 899 transhipped with Chinese Taipei-flagged vessels in 130 of 136 partnerships, PINGTAIRONGLENG2 with Chinese vessels in 91 of 98, and MV BADARO with South Korean vessels in all 32. None of that is explained by where the fish are.
The ownership data (matched for 69% of fishing vessels, with Chinese Taipei the weakest spot, either because ownership is atomised or because the data is thin) shows two ways of organising the same activity.
The first is vertical integration. Pingtairong Ocean Fishery owns PINGTAIRONGLENG2 and 11 of the fishing vessels that regularly tranship with it. Dongwon Industries owns MV BADARO and six of its partner vessels. In both cases, an owner moves catch from its own longliners to its own carrier on the high seas.
The second is the opposite. Korean groups such as Sajo Industries (14 vessels across two carriers), Dong Won Fisheries (nine vessels, three carriers) and Silla (eight vessels, three carriers) spread their fleets across several carriers, including non-Korean ones like TAIHO MARU. SEISHIN works as a shared hub, taking vessels from Korean, Chinese and Chinese Taipei owners without belonging to any of them.
Now think about the second limb of the test, which asks whether port transhipment would force a significant and substantial change to the vessel's historical mode of operation. If you own both ends of the transfer, the supply chain is your own design, and you can redesign it. If you shuffle your fleet between carriers from trip to trip, you are already changing your mode of operation all the time. Neither looks like a fixed, externally imposed constraint, which is what that limb assumes.
Why carrier-based monitoring cannot keep up
The same structure is a monitoring problem. 176 fishing vessels, 36% of the network, transhipped with more than one carrier, and two Chinese Taipei vessels, SING MAN YI NO3 and NIAN SHENG NO168, used four of the six. Catch from a single longliner can enter several carrier logistics chains, none of which sees the others.
Carrier size matters too. MV BADARO, the biggest at around 4,600 GT, has the longest median event at 8.9 hours, while DONG HRONG 899, at about 499 GT, sits at 4.2. Smaller carriers produce lots of short, interrupted encounters, which tells you something about how much fish actually moves and how hard it is to verify.
And then there are the odd ones. A PINGTAIRONGLENG2 event with its sister vessel PINGTAIRONG89 in December 2024 lasted 104.7 hours. That is not a transhipment; that is a residency.
What a port call actually costs
None of this means port use is free or simple. Back in 2019 I wrote about the factors behind the choice of transhipment port for purse seiners, and the same drivers apply to longliners: licensing conditions, distance to grounds, services, medical facilities, flights, the safety of the anchorage, the quality of the agents, how reliably the line agencies turn up, and access to shore for the crew. And yes, weak port state oversight acts as a perverse incentive for some skippers.
A port call does not come with one fee. It comes with somewhere between 30 and 50 separate charges from port authorities, border agencies, fisheries and monitoring, and the agent who bundles them. For a 70 m fishing vessel transshipping 920 t over five days, our estimates per visit range from about US$1,975 in Rabaul to US$12,404 in Funafuti, with Tarawa, Pohnpei and Majuro around US$5,000 to US$5,500.
Set that against a carrier burning US$5,000 or more a day holding position at sea, and against the fishing vessel's own detour. The numbers are not the wall they are often made out to be.
There is a real equity issue inside those charges, though. Many are flat per call. A 350 GT longliner pays broadly the same customs, immigration, sanitation and boarding transport costs as a 5,500 GT carrier, despite being less than a fifteenth of its size. Scaled fisheries transhipment charges could help, but with care. Six years of data show incentives alone have not moved fleet behaviour, and Pacific countries cutting their own charges unilaterally may end up losing more than they gain.
What we suggest
The minimum step is the one the Commission has owed itself since 2012: every impracticability determination should be backed by evidence. Paragraph 34 of CMM 2009-06 lets a member determine impracticability for its vessels and paragraph 35 makes it name them, but nothing says what the determination must rest on. Beyond that, we suggest:
Require disclosure of actual fuel costs and government fuel support when hardship is claimed, and assess hardship across the supply chain, including the carrier's costs, wherever the same owner controls both vessels.
Establish an independent high-seas transhipment observer programme, as already operates in IOTC, ICCAT and IATTC and as was recommended in 2024. Carrier-level coverage cannot follow vessels that move between carriers, and 36% of them do.
Consider scaled fisheries transhipment charges as a complementary incentive for port use, recognising that the fixed charges fall hardest on smaller longliners.
The paper's metrics are reproducible and can be applied vessel by vessel as new data comes in. The carrier and flag combinations where the ratio sits consistently above one are already identifiable, which gives members a natural starting point for scrutiny, if they want one.
To finish
The exemption was meant to be the exception. When it covers almost everyone, it is no longer an exemption; it is just the rule with extra paperwork, and in this case, not even much paperwork. The eastern hotspots show there is a legitimate core to the impracticability argument, and nobody is asking boats 1,600 NM from Avarua to sail in. But for the rest, the tracks are clear: ports passed, carriers met, and the costs borne by the island states that did not get the call.
As in 2024, I'm quite proud of this work, not only for the results but because a fisheries administration and a technology provider did the analysis together, rather than waiting for someone else to do it.
The full paper, with all the figures, the network graphs and the data annexes, is on the TCC22 meeting page as WCPFC-TCC22-2026-DP06