Continuing with my interest in the papers going to the 22nd Scientific Committee of the WCPFC in Apia this August, I want to look at one that sits right at the intersection of science, management and money: the annual update on indicators of effort creep in the purse seine fishery. The paper is WCPFC-SC22-2026-MI-IP01, by Paul Hamer and Thom Teears of SPC's Oceanic Fisheries Programme together with the PNA Office.
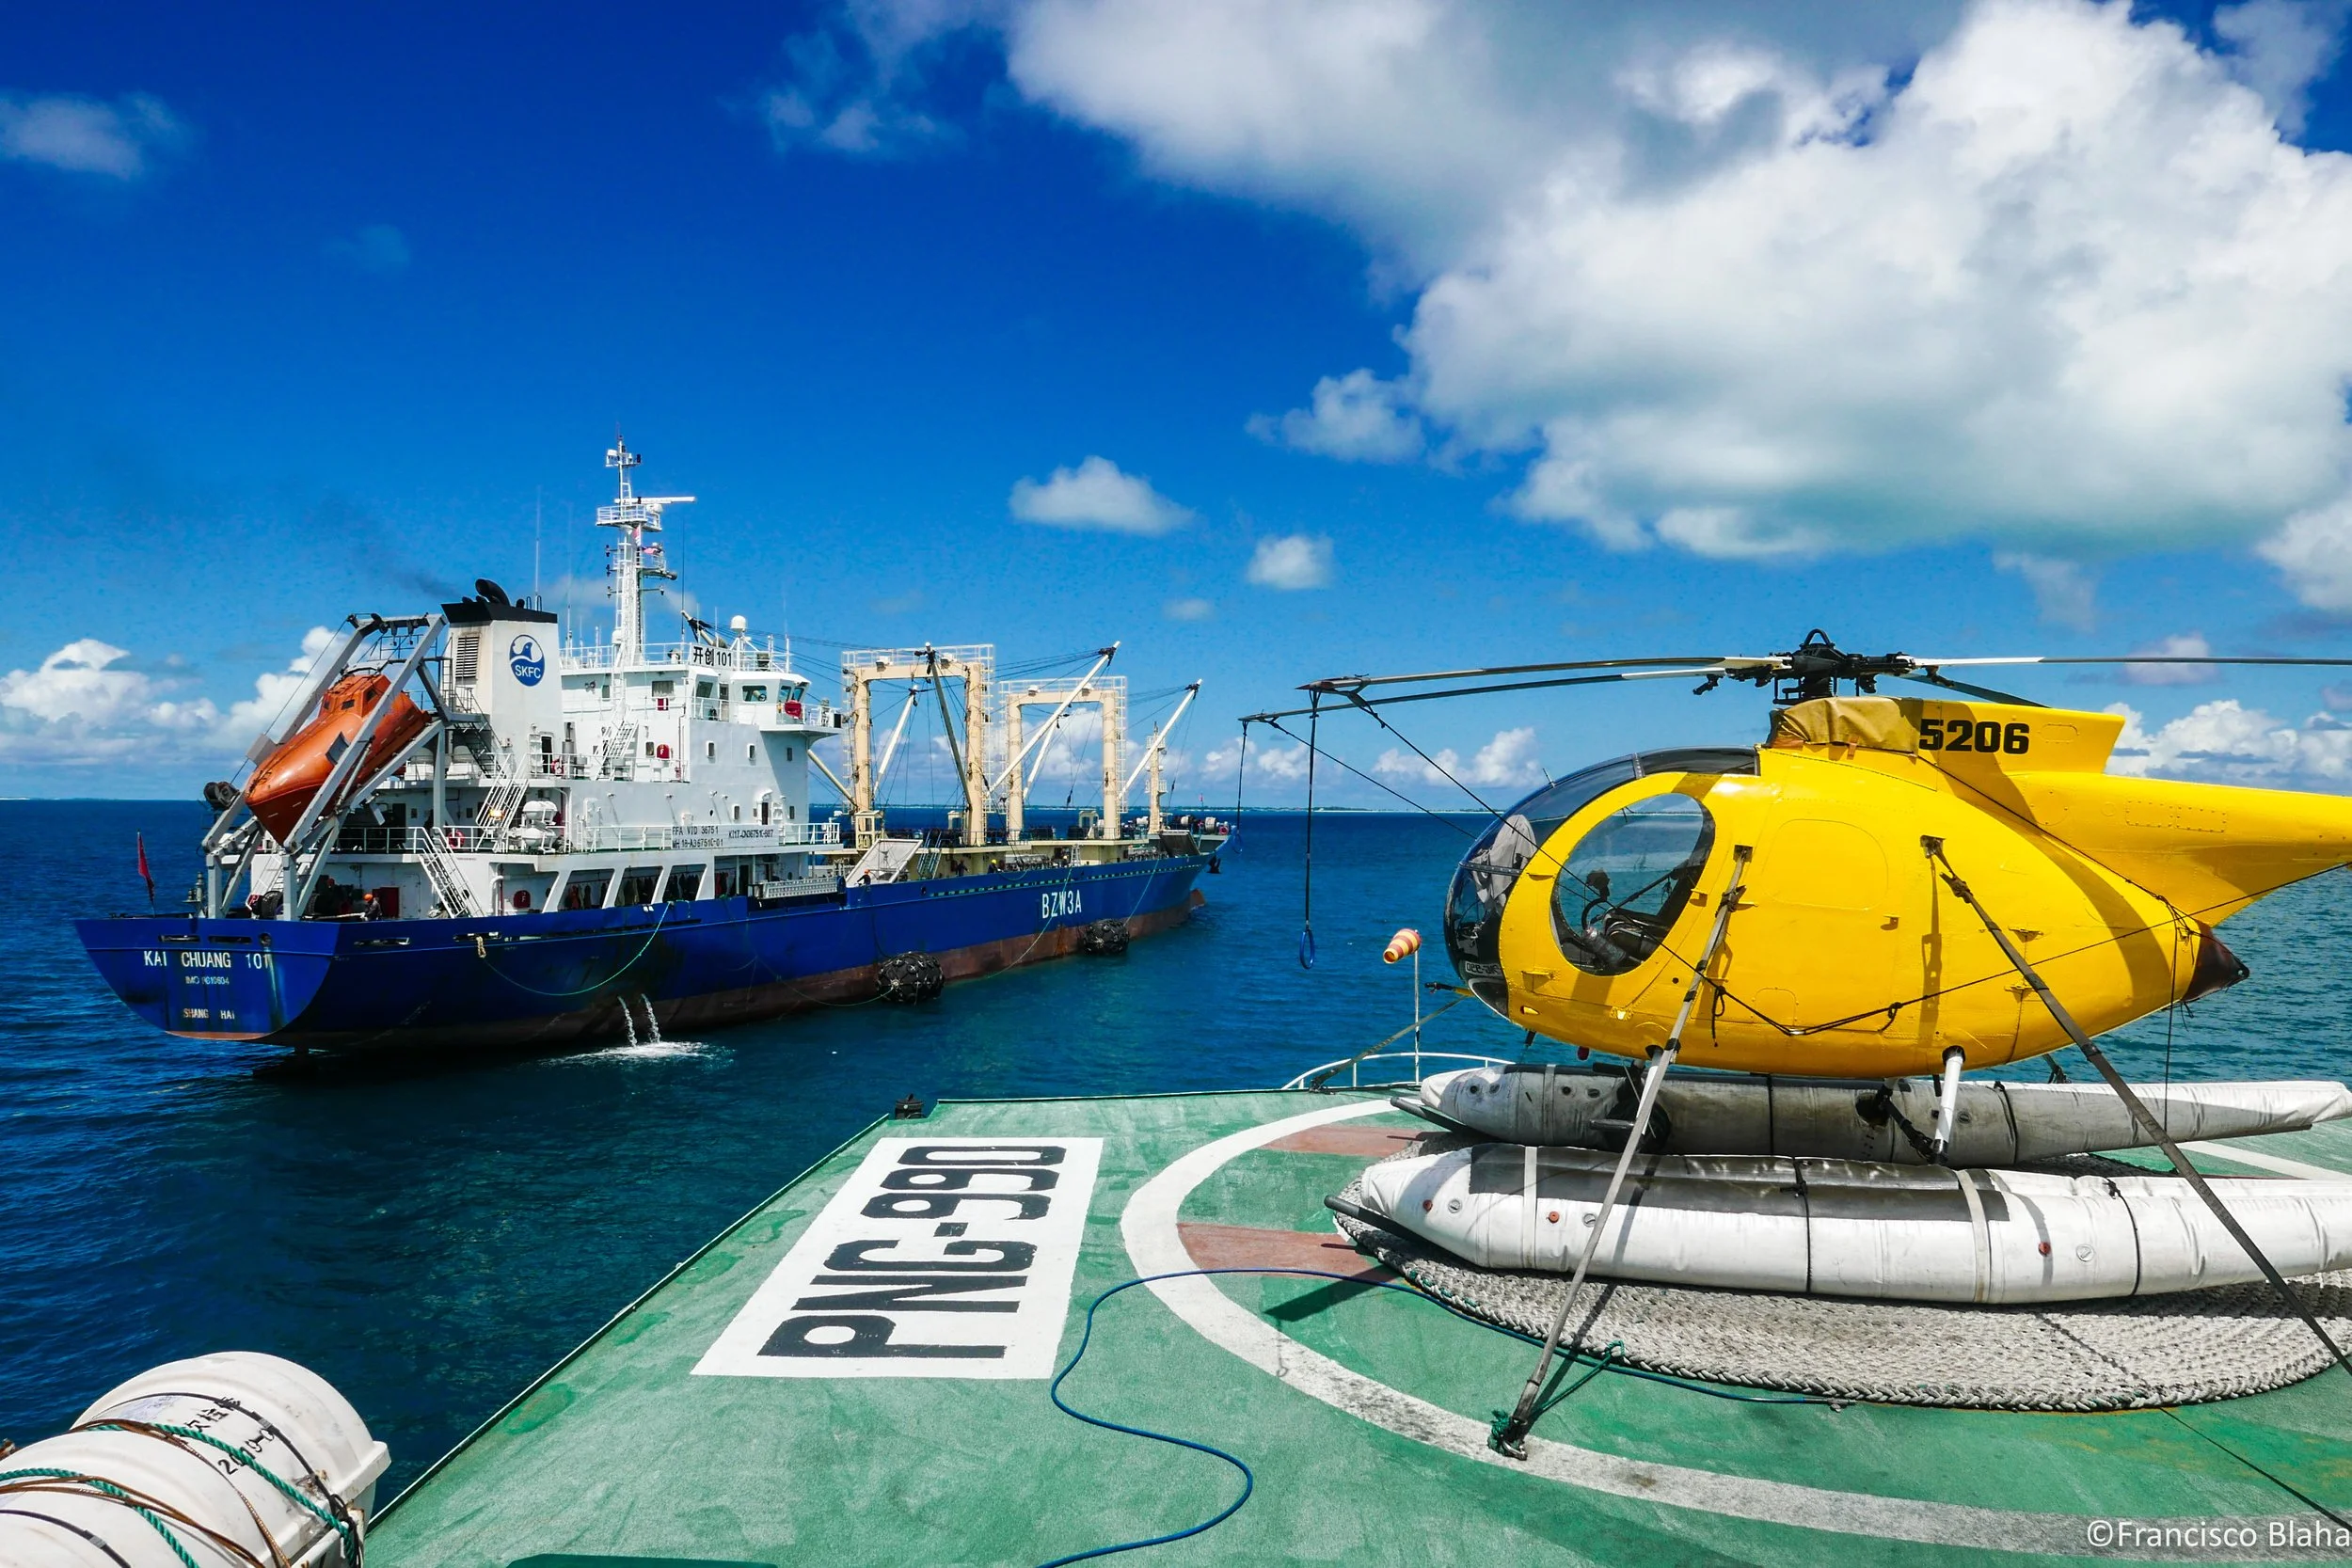
I remember when having a chopper was a worry on creep… good old days
Why this paper?
The Vessel Day Scheme is an effort control. You do not limit the tonnage of skipjack a vessel takes; you limit the number of days it can spend fishing. That works beautifully as long as one fishing day keeps meaning roughly the same volumes of fish caught. The moment a day catch “drifts” towards catching more fish than it used to over time, that assumed limit quietly loosens without anyone changing a number in a management measure.
That drift is what fisheries people call ”effort creep”, which is an area I've been interested in for a while (particularly when it comes to dFADs but also on longline). Creep comes in two types: the direct kind is more sets inside the same day, more nominal effort squeezed into the unit you bought. The indirect kind is each set becoming better at catching fish, through gear, electronics, skipper skill, better information, better networking. The first is easy to count. The second is genuinely hard.
Paragraph 2.4(ii) of the VDS text obliges the Administrator to brief the Parties annually on catch, effort and any observed or potential increase in average effective fishing effort per day since the scheme started. SPC has been producing this analysis with the PNAO since 2016, when Pilling and colleagues first set out the candidate indicators. This year's version runs complete data from 2007 and 2008 through 2024, with some observer series into 2024, and the authors recommend it supersedes earlier versions because data inputs get refined over time.
The fishing day and the VMS
Before getting to the results, there is a data story here that deserves attention from anyone working in MCS, because it is a nice example of reported data going quietly wrong.
Since around 2010, the raised logbook estimates of fishing days have become increasingly biased low. The reason appears to be misreporting of vessel activity codes, specifically what would previously have been logged as searching now being logged as transit. Searching is fishing effort. Transit is not. Under the VDS, a day spent steaming from one FAD to another is a fishing day, and it gets charged as one. So a fleet that codes its searching as transit ends up looking, in the logbook data, like it is fishing far fewer days than it actually is. And if you divide sets by an artificially small number of days, you manufacture an apparent increase in sets per day. In other words, the bias runs in exactly the direction that would create a false effort creep signal.
Since 2022, SPC has instead derived fishing days from VMS, applying criteria based on position and vessel speed to identify searching and active fishing. Those VMS days line up much more closely with the days recorded under the VDS. They run higher than VDS days, which is not surprising given the VDS claims process for non-fishing days, but the trend and variation track well.
The team recommends continuing with VMS days and refining the algorithms using observer data for ground truthing. Work to correct the historical logbook record is ongoing, though the paper is honest that progress in 2024 and 2025 has been limited by staff turnover in SPC's data management team and competing priorities.
For me, this is the quiet headline. A core management indicator was being distorted by reporting behaviour on the vessel, and it took an independent data stream to notice and correct it. That is a good argument for keeping multiple sources rather than trusting the logsheet alone.
What the indicators actually show
The analysis excludes archipelagic waters of PNG, Solomon Islands and Kiribati, since effort there is not under the VDS, and filters to 20N to 20S, dropping the smaller domestic fleets of Indonesia, the Philippines and Vietnam. Results are presented separately for PNA waters (PNA EEZs plus Tokelau) and everything else.
On nominal effort, sets per fishing day in PNA waters sit consistently just below 1.0, with a very slight declining trend since 2008. That is the opposite of what you would expect if vessels were cramming more sets into each purchased day. Outside PNA waters, the rate is lower and more variable, with a flat long-term trend. Observer data, which only counts days when sets were actually made and therefore gives higher values, tells the same story. Between roughly 15 and 30% of active fishing days in PNA waters involve more than one set, and 5 to 25% outside. There was an uptick in 2024, tied to a big jump in unassociated sets, and the authors note a slight increasing trend may be emerging, but nothing sustained.
On effectiveness, catch per set for total tuna shows no long-term trend since 2007 for either set type, in either area. Associated sets consistently produce about double the catch rate of unassociated sets, which is unsurprising given how many free school sets come up empty. Comparing 2023 and 2024 against 2021 and 2022, catch per set was down 1 to 2%, while catch per day was up 8% in PNA waters and 18% outside, all within the range of variation seen since 2008.
Vessel characteristics are similarly stable. Length, gross tonnage and horsepower have moved between zero and 1% a year since 2007. Well capacity is the outlier, up 16% between the two recent periods. The authors make the sharp point that VDS day charging by vessel size is itself a brake on hull growth, so the fleet has stopped getting bigger and started getting smarter instead.
The creep that already happened
Here is where the paper gets more interesting to me. When the authors extend the catch per set series back to 1990, a clear increasing trend appears for associated sets from 1990 to about 2007, and then it flattens. Unassociated (free school) sets show no such trend in either period.
That rise maps onto the transition from drifting logs to human-made drifting FADs as the dominant associated set type, which was made possible by cheap satellite tracking buoys. Their conclusion is that the most important period of effort creep in the history of this fishery happened before the VDS came in. By the time the scheme was implemented, the big efficiency jump had already been banked into the baseline.
Which raises the obvious question: why did the acoustic FAD buoys that came later not produce another jump?
The authors offer two explanations. One is that the technology may be less useful than assumed, giving a coarse presence signal rather than a reliable biomass estimate, and that its real value may lie in cutting steaming time and fuel cost rather than lifting catch per set. Also, a vessel can only set on FADs it can actually reach, and it has no control over where its FADs drift, including into EEZs where it has no access or no days. You cannot cherry-pick the best buoy if you cannot get to it.
The second explanation is management. The package introduced from 2007 by PNA and WCPFC- the VDS limits and pricing, FAD closures, high seas effort limits, more restrictive access, and the shift from roaming distant water fleets to domestic fleets fishing mostly at home- brought a pace of change beyond anything seen in other tuna fisheries.
The comparison is telling. In the Atlantic and Indian Oceans, the FAD share of catch has climbed to around 80%. In the WCPO, it has sat at around 50%, with roughly 70% of sets still made on free schools. Something is discouraging the switch that happened everywhere else.
The caveats worth keeping
The authors are careful not to oversell a null result, and neither should we.
Stable catch rates are not proof that nothing is happening. If efficiency gains are running against declining stock, the two can cancel out and leave a flat line. Purse seining is also highly selective, which makes catch per set prone to hyperstability, holding up even while a stock moves. That is why the catchability proxy matters: skipjack catch per day divided by assessed biomass. Against the 2025 assessment, which shows relatively stable spawning biomass since around 2010, that proxy is flat for PNA waters and very slightly increasing outside. Notably, this is weaker evidence of creep than the 2022 assessment gave, which showed around 2 % per year.
Aggregation also hides things. These are regional numbers, and the paper is explicit that individual flags or EEZs could show patterns the aggregate does not, which is precisely the sort of analysis a PNA member might want for optimising returns on its own day allocation.
And FADs remain the big data gap. Escalle and colleagues estimated 31,000 to 39,500 buoy deployments a year in the WCPO between 2016 and 2019, against roughly 11,000 associated sets in 2024. Most deployed buoys are never set on. The number of FADs a vessel is actively monitoring on any given day is plausibly a real component of fishing effort, and it is not captured anywhere in this analysis. SPC is building a FAD database off the back of PNA logbook reporting, and the authors recommend adding deployment and monitoring indicators in future updates.
What SC22 is being asked to note
The invitations to the Committee are modest but pointed. No clear evidence of effort creep since VDS implementation. Clear evidence it occurred before, during the drifting FAD transition. Recognition that the policy package may itself be constraining creep. Continued VMS work, continued logbook correction, and a suggestion I think deserves attention: review the role of this paper in relation to the WCPFC skipjack management procedure, since the MP now changes how VDS limits get adjusted rather than leaving them to periodic renegotiation of the Tropical Tuna Measure.
The finding that effort creep is not undermining the VDS is, as the authors themselves say, contrary to what might have been predicted. That is worth a lot of thinking about. It suggests the scheme, along with the FAD closures and access controls around it, has done something that effort-based management is generally assumed to fail at. But it is a finding held up by indicators the paper openly describes as imperfect, resting on data streams that have already been shown to drift.
Keeping it honest depends on better FAD data, better activity reporting, and continued willingness to check the logsheet against the VMS.