A few weeks ago I wrote about what happens to the fish that swim away, the new study on post-release mortality in the SNA 1 snapper fishery. That piece looked at the fate of released fish, roughly a fifth of them dying anyway despite swimming off looking fine. I have since gone through the full Fisheries New Zealand assessment report behind that study, and there is a second story in it that deserves its own space: how much snapper actually gets caught in this fishery, as opposed to how much gets counted.
The short version is that the recreational snapper fishery across East Northland, the Hauraki Gulf (Auckland included) and the Bay of Plenty is enormous, and most of what gets hooked never gets weighed, logged, or reported anywhere. It just goes back over the side. The official harvest numbers that feed into stock assessments and catch allowances only see a fraction of what actually happens on the water.
Where the data came from
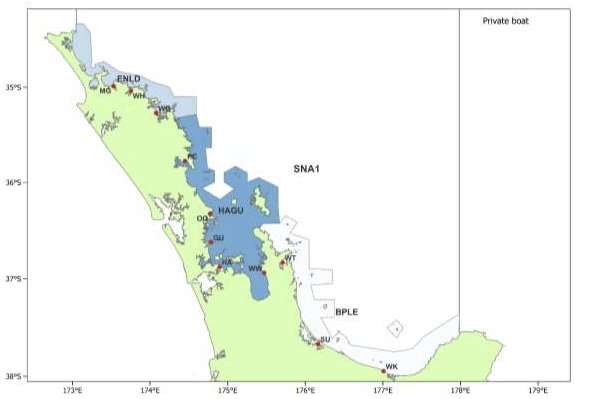
The study, led by Jade Maggs and colleagues from Earth Sciences New Zealand and Blue Water Marine Research, ran from January 2024 to January 2025. Interviewers worked at eleven boat ramps from Mangōnui in the north down to Whakatāne in the Bay of Plenty, catching private trailer boat fishers as they came off the water. Trained observers rode along on charter boats out of nine ports covering the same stretch of coast. Between the two sectors, they recorded 24,013 individual snapper: 16,921 from private boats across 1746 sampled outings, and 7092 from charter boats across 240 sampled trips. For each fish they logged length, capture depth, where it was hooked, and whether it was kept or released.
That is a serious amount of fieldwork, and it is worth saying so because the resulting numbers carry real weight.
More than 60% goes back
The headline figure is that 62% of snapper caught by private boat anglers were released, and 69% of snapper caught on charter boats were released. Most of what gets released is undersized: 84% of the private boat releases and presumably a similar pattern on charters, since 53% of all private boat catch and 60% of charter catch was below the 30 cm minimum legal size.
Put plainly, for every legal fish that ends up in a chilly bin, roughly one and a half to two more get caught, ideally measured against a ruler, and put back (or kept until a bigger one is caught)
That release rate held up fairly consistently across all three regions. It eased off a little in winter in the Hauraki Gulf and Bay of Plenty, when more of the fish around happened to be legal size, but the underlying pattern of high release rates was there everywhere the researchers looked, from the Mangōnui boat ramp in the far north to Whakatāne in the east.
Scaled up to the whole fishery, private boat anglers released an estimated 903 tonnes of snapper over the year, 2.1 million individual fish. The Hauraki Gulf, unsurprisingly given how much fishing pressure it carries around Auckland, accounted for the bulk of that at 551 tonnes, followed by the Bay of Plenty at 210 tonnes and East Northland at 142 tonnes. Charter boats released a further 207 tonnes, 462,000 fish, again concentrated in the Gulf. Add the two sectors together, and you get somewhere around 1110 tonnes of snapper, 2.6 million fish, handled and returned to the water across SNA 1 in a single year.
That is close to three-quarters of the entire commercial Total Allowable Commercial Catch for the stock, caught and released by recreational fishers alone.
What the official numbers actually measure
Here is where the second, less discussed part of the story comes in. New Zealand's recreational catch statistics for SNA 1, the ones that feed into the Total Allowable Catch and the recreational allowance, come primarily from two sources: the National Panel Survey (NPS), a periodic survey of private fishers, and the Amateur Charter Vessel (ACV) database, which charter operators are required to fill in. Both of these systems are built to estimate landed harvest. What gets weighed at the ramp, what gets logged by the skipper. Neither was ever designed to capture the fish that get thrown back.
The 2022-23 NPS put the private boat snapper harvest at just over 1.3 million fish, 1514 tonnes. The ACV database recorded 237,141 snapper landed by charter boats that year. Add those together, and you get a landed harvest of roughly 1.54 million fish, a bit under 1800 tonnes. That is the number that shows up in the official accounts.
But when Maggs and colleagues combined their catch characterisation data with those harvest figures, to work out the actual total number of snapper being caught (kept plus released), the picture looked very different.
Their model put total private boat catch at close to 3.44 million fish, about 2518 tonnes. Total charter boat catch came out around 699,000 fish, roughly 488 tonnes. Combined, that is somewhere in the order of 4.1 million snapper actually being caught across SNA 1 in a year, against an official landed harvest figure of 1.54 million.
In other words, the landed harvest numbers that management decisions are built on capture only around a third to two-fifths of what is genuinely being caught. The rest, well over half, exists only in this kind of dedicated at-sea survey, and even then only because someone thought to go and measure it.
I want to be careful here. This is not a story about unreported fishing or people hiding their catch. Nearly everything being released is being released because the law requires it: undersized fish, fish over the bag limit (yet you argue what you kept fishing, then). The system is doing roughly what it was designed to do. The point is narrower and, I think, more interesting: an enormous amount of fishing mortality and fishing pressure simply does not appear in the data that gets used to judge how healthy a fishery is or how much room there is to move on catch limits. If you only ever count what comes home in the bin, you are missing most of what the fishery is actually doing to the fish stock.
Why that gap matters
This is where the two threads from my earlier post and this one come together. SNA 1 carries a Total Allowable Catch of 8050 tonnes, split between a commercial allowance, a recreational allowance, a small customary allowance, and a 450 tonne allowance for everything else, illegal take, ghost fishing, and mortality among fish that are returned to the sea.
This study put annual release mortality, fish that swim away but die anyway from barotrauma or hook damage, at 200 tonnes for private boats and 48 tonnes for charter boats. Combined, that is 248 tonnes, on its own accounting for 55% of the entire 450 tonne allowance for other mortality, an allowance that is also meant to cover the much larger commercial fishery's own sources of unaccounted loss. The number of individual fish involved was around 582,000 snapper a year, dying after being carefully unhooked, measured, and returned to the water by anglers who almost certainly believed they were doing the right thing.
None of that 248 tonnes shows up as harvest anywhere. It is not landed and is not eaten. It simply disappears from the stock, invisibly, inside a number that until this study was, in the authors' own words, "somewhat arbitrary."
Most of that mortality risk traces back to two things: how deep the fish was hooked from, and where the hook ended up. Fish caught from medium and deep water die at much higher rates than fish caught in the shallows, and a fish that is gut-hooked or foul-hooked is far more likely to die than one hooked cleanly in the lip.
The good news buried in the data is that the great majority of snapper across both sectors, 88% on private boats and 95% on charters, were lip hooked, which is the main reason the overall mortality rate is not far worse than it is.
The incentive gap again
I made the point in an earlier piece about the Fisheries Amendment Bill debate that incentives, not intentions, tend to drive outcomes in fisheries. That argument was mostly about commercial discarding, but it applies just as cleanly here. Under the current settings, there is no cost attached to catching a fish you are not allowed to keep, so there is no real incentive to avoid catching it in the first place. Fishers fish the same grounds, use the same rigs, and simply sort the legal from the sub-legal fish at the rail. The 4.1 million fish being caught each year is not a sign of fishers doing anything wrong. It is the predictable result of a management system built around size selectivity rather than encounter rates, applied to a stock that has recovered strongly enough that undersized fish are now everywhere on the upper east coast.
A fishery that is mostly invisible
What strikes me most reading through the full report is how much of this fishery's real footprint sits outside the numbers we normally use to talk about it. SNA 1 is often described, rightly, as the biggest recreational fishery in New Zealand, and the landed harvest figures are already substantial. But the total number of fish handled, measured, and returned to the water each year is more than double what gets landed. That is not a criticism of fishers, most of whom are simply following minimum size and bag limit rules that were designed decades ago around very different assumptions about what "release" costs the fish. Yet it is a criticism of their noisy opposition to any change.
It is a reminder that fisheries management built entirely around landed catch is, by construction, managing only part of the picture. The rest, the fish that get caught, judged too small, and sent back, has real biological consequences, and until surveys like this one go out and count it directly, it stays off the books. Good management needs to see the whole fishery, not just the part that ends up in the chilly bin.