At this time of the year, for every app we have, we have been given a complete set of statistics on how the year was. So I thought I'd do the same, in case any of you care.
And when I say you... I very rarely know who you are... As a self-employed consultant, I hardly get the chance to attend conferences and events like that, so when I do get invited, it's always great when someone comes up and says, "Hi, I read your blog and like this or that, or it's good to read what you think about this and that`’
Yet I remind myself constantly that writing a blog does not make one meaningful!
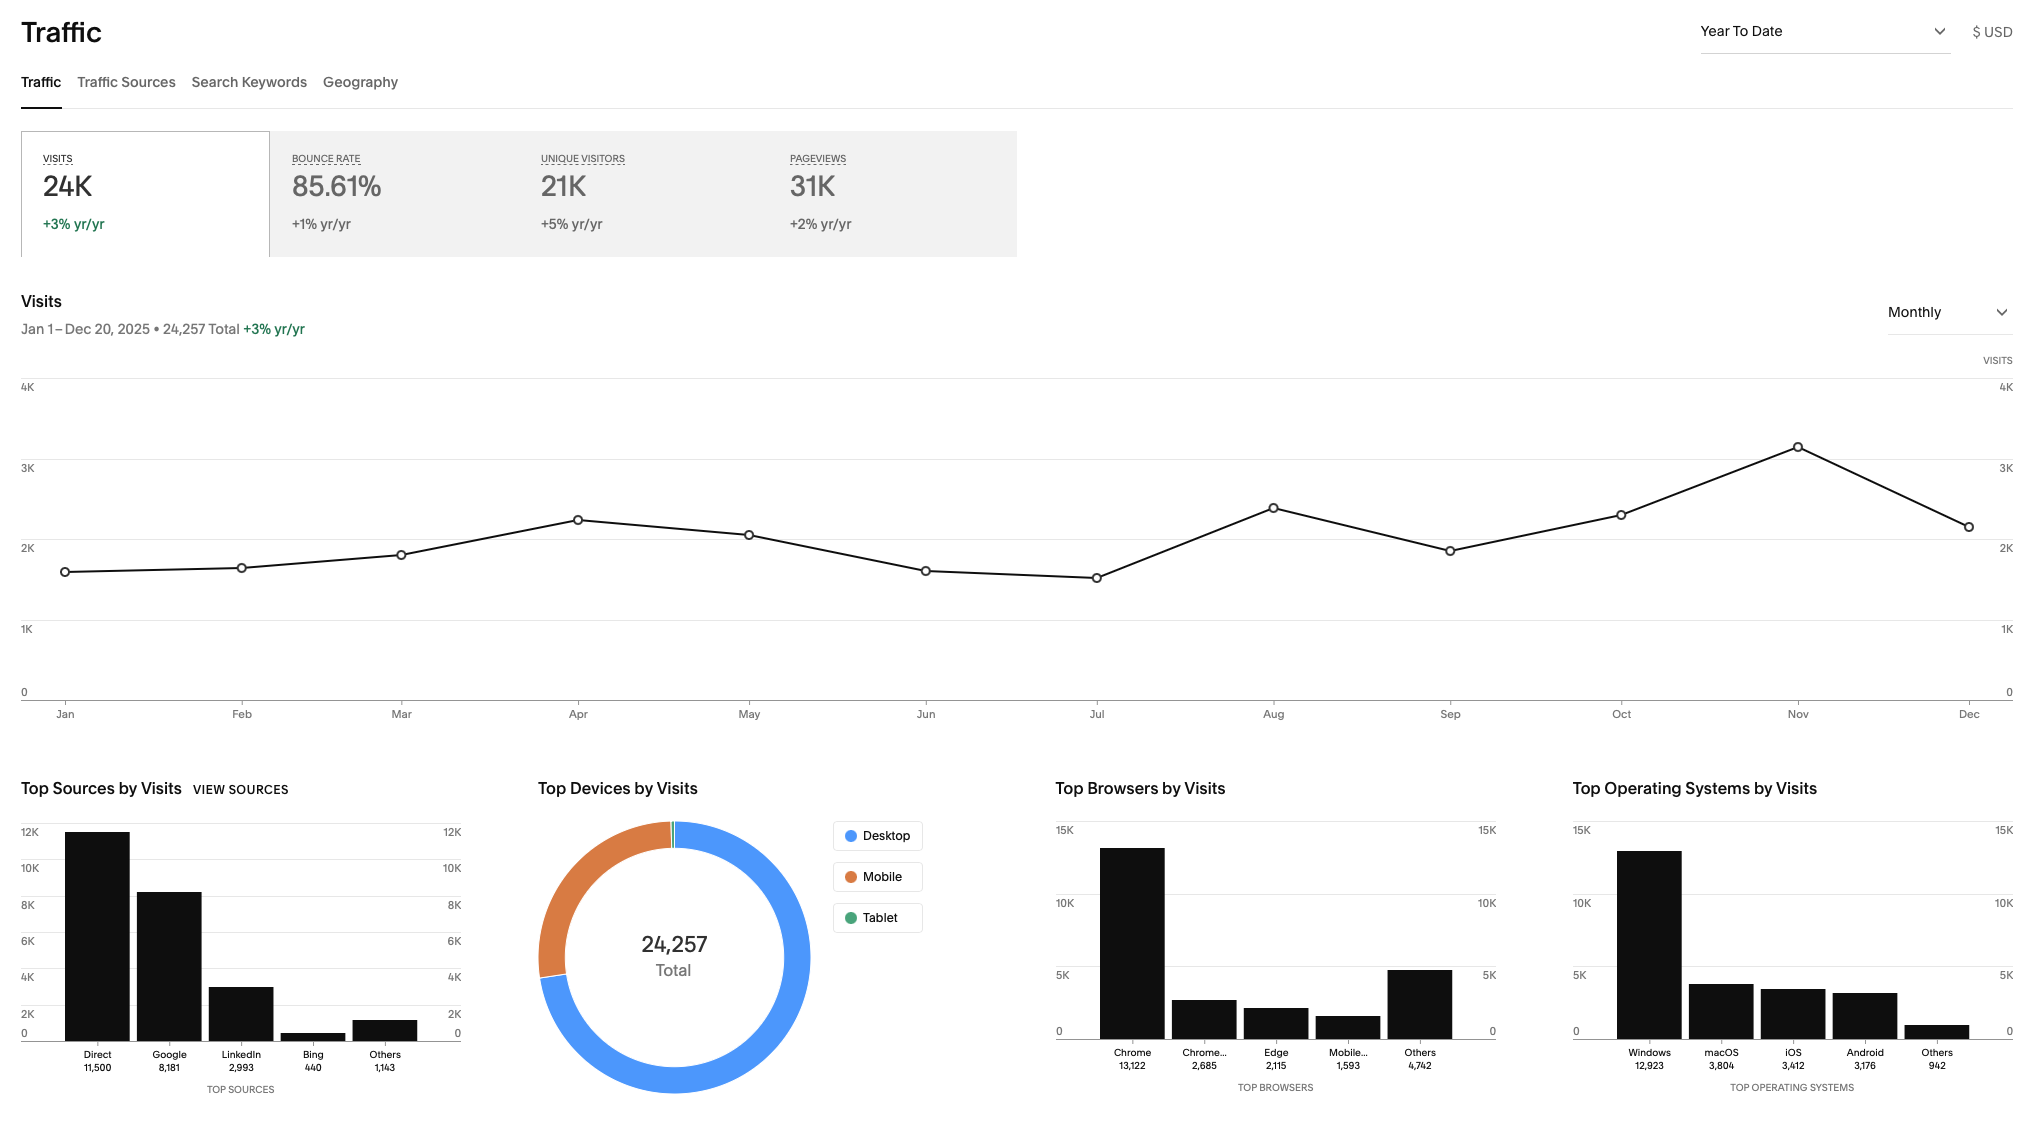
In any case, for 2025, there have been 24,000 visits, with 21,000 unique visitors who read 31,000 pages. Most of you (11500) come directly to the page, use Windows (12923), and browse with Chrome.
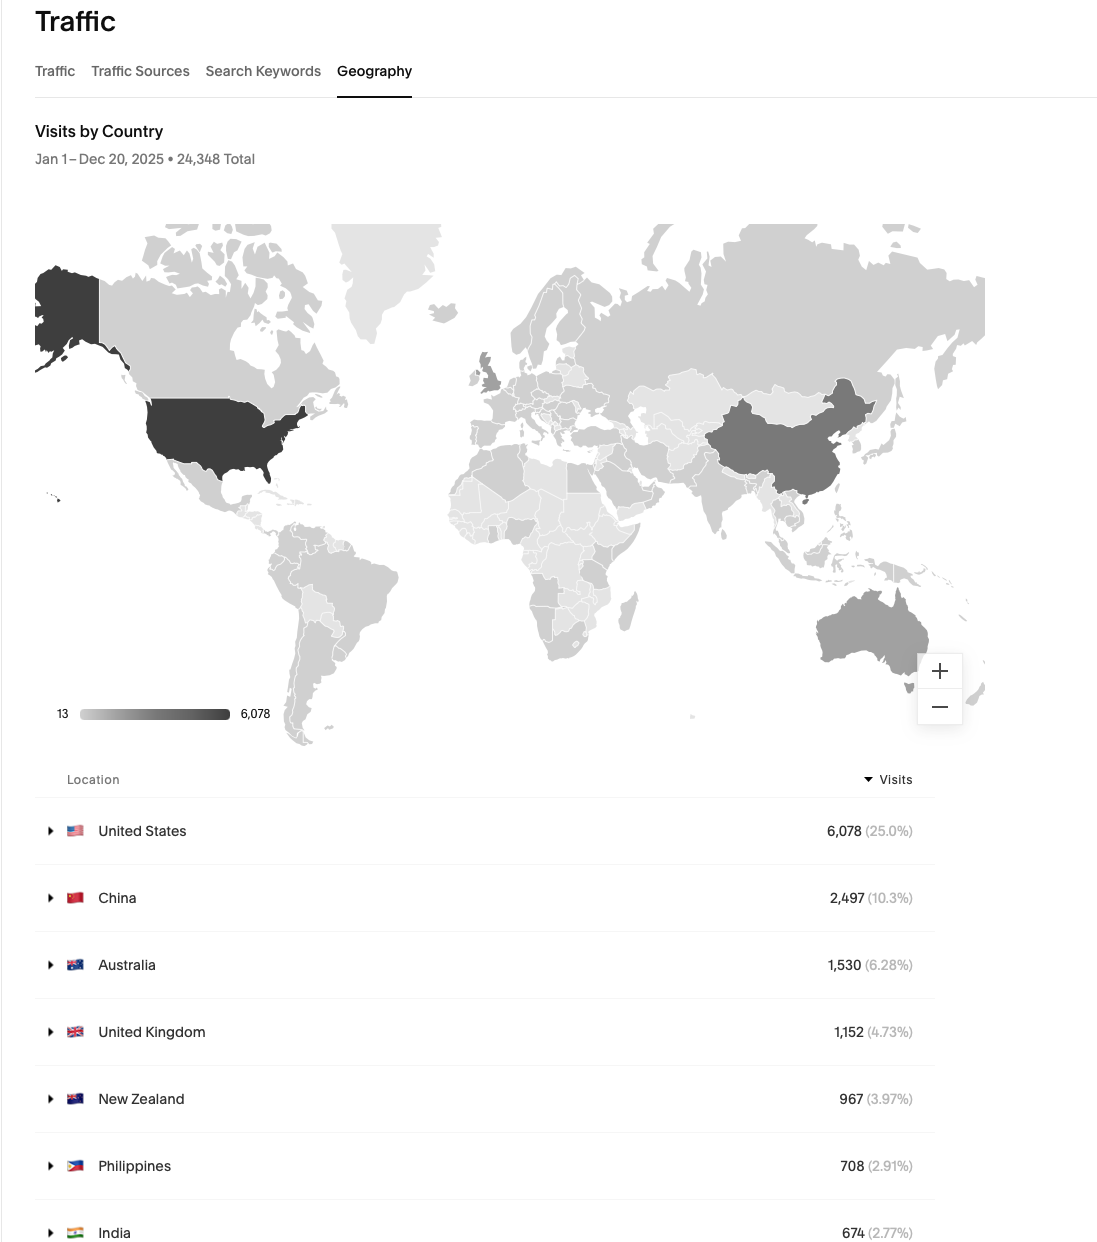
Currently, 25% of you are based in the USA, 10% in China, 6.28% in Australia, and 4.73% in the UK... which, interestingly, are all countries I haven’t worked in.
Now… I also realised recently that I started this blog in January 2014 just because it was offered for free with the template I chose from Squarespace – the hosting platform for this website – and not because I had any inkling of being a blogger.
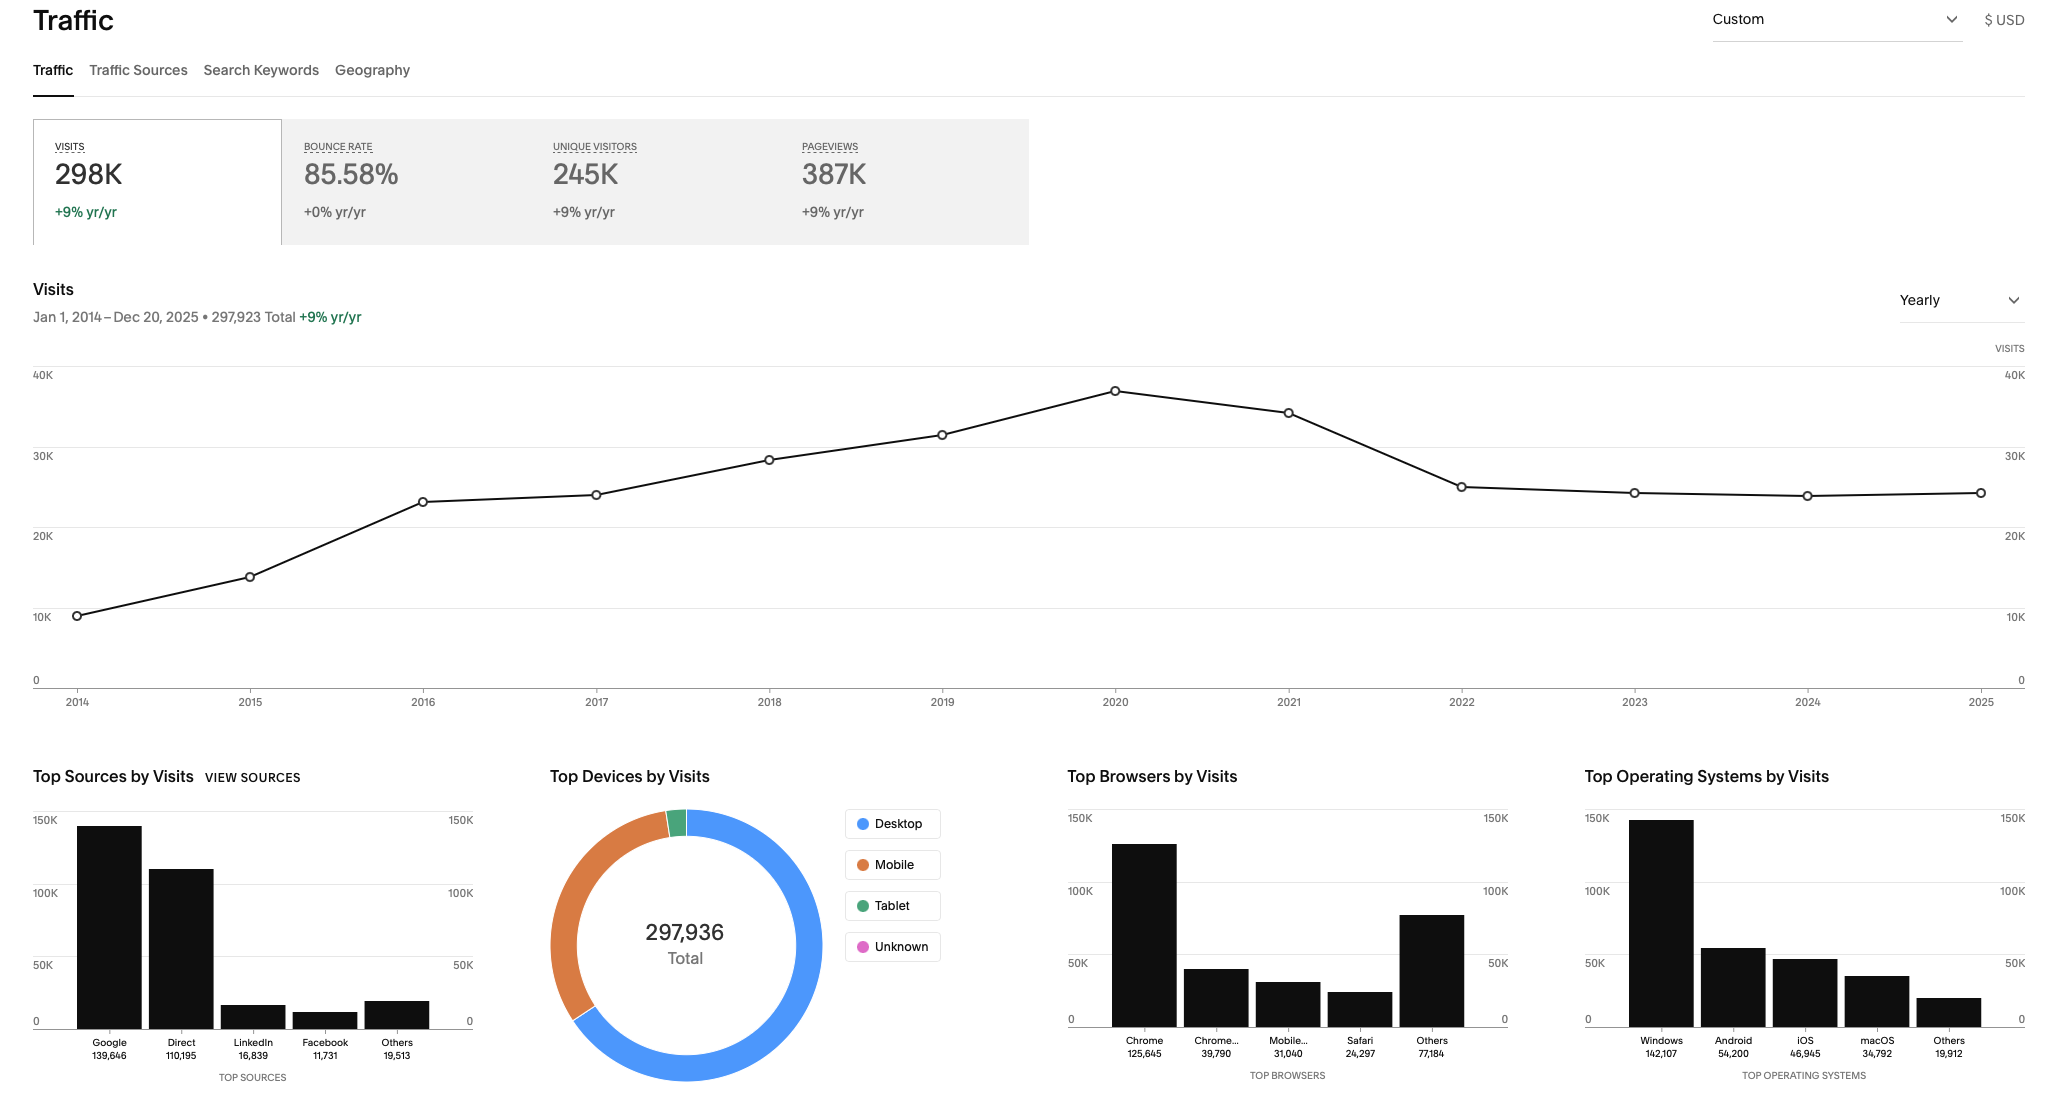
And as such, I can tell you that in the last decade, this blog has been viewed 387,000 times by 245,000 unique visitors across 298,000 visits. (It peaked in 2022 during the COVID pandemic at 38000 visits, but also then I quit most social media, so a lot of traffic subsided too)
Needless to say, these figures are truly astonishing for me, since I see myself as a fisheries operational consultant who writes a blog in my free time and not a “science communicator'‘, and I don’t have any form of sponsorship or pay for promoting this blog
Thank you all for your time and interest. I wish you all a beautiful time off with your loved ones.