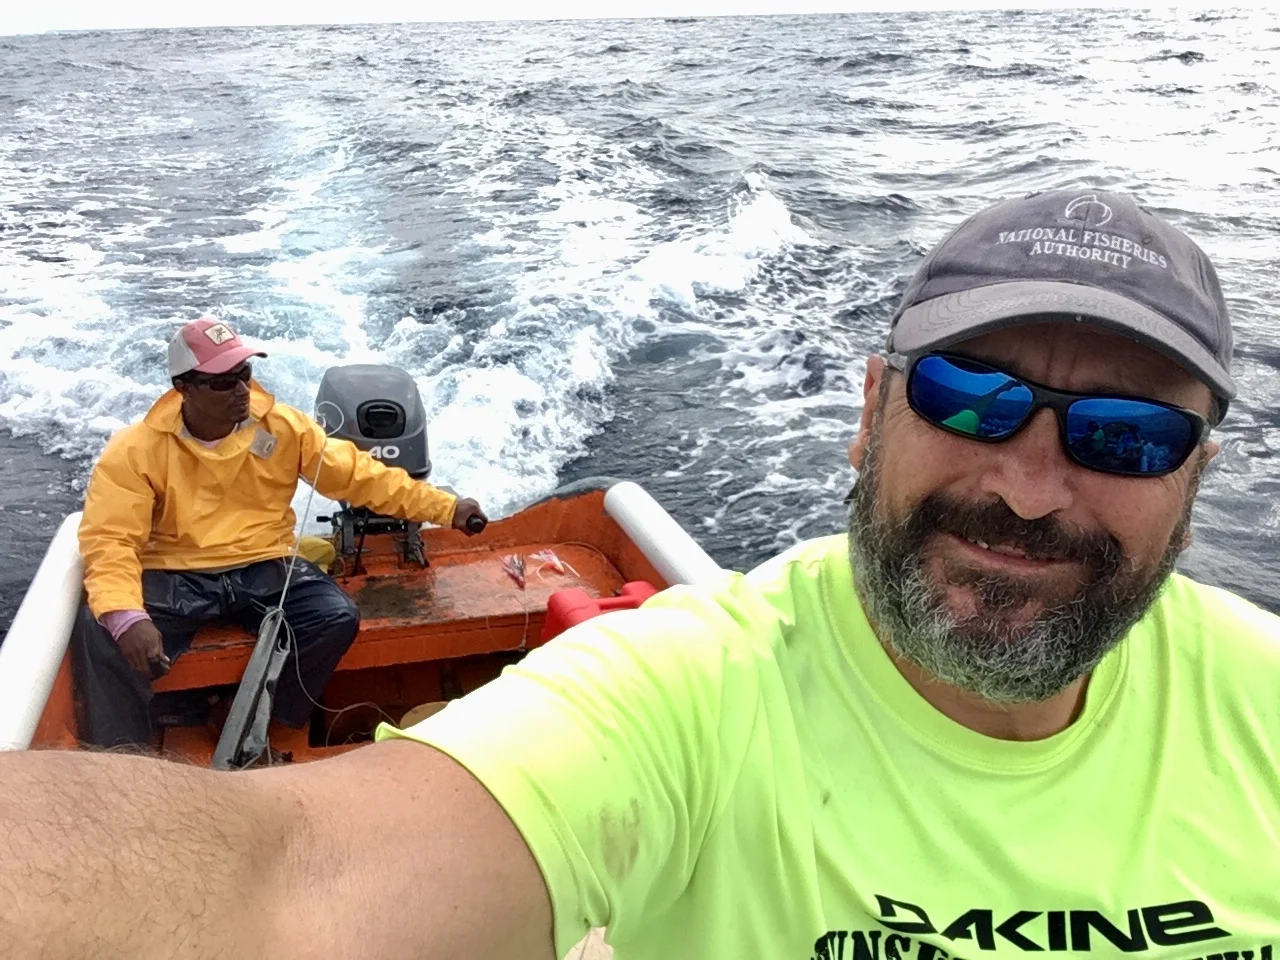
The biggest “conditioning factor" for the time a fishing vessel can fish is fuel. Even if efficiency has moved forwards a lot, there are substantial fuel users… According to an ISSF-commissioned study, the longliners burns roughly 1,070 litres of fuel to land one ton of tuna (in comparison a Purse Seiner burns 368 for the volume, but catches way more per set)
Furthermore, the bigger your fuel thanks the smaller the space for your fish (and at least if the vessels is EU approved, cannot use fish holds as fuel thanks as most vessels actually do), hence (as anything in fisheries) is all about compromises.
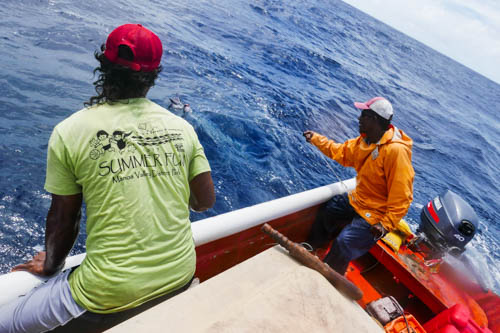
If vessels had to come back to port to refuel every time they run out, fishing as we know it would not exist (may be a good thing). In any case, the dependence of vessels to stay at sea for more than their autonomy based on the capacity of their fuel thanks is ONLY via bunkering (the supplying of fuel for use by ships) and this is a world on itself. A world many many people in fisheries (including me) don't really know a lot about. The ones I was involved always were a decision in between the skipper, the vessel manager on one side, and the captain of the bunker and its owners on the other.
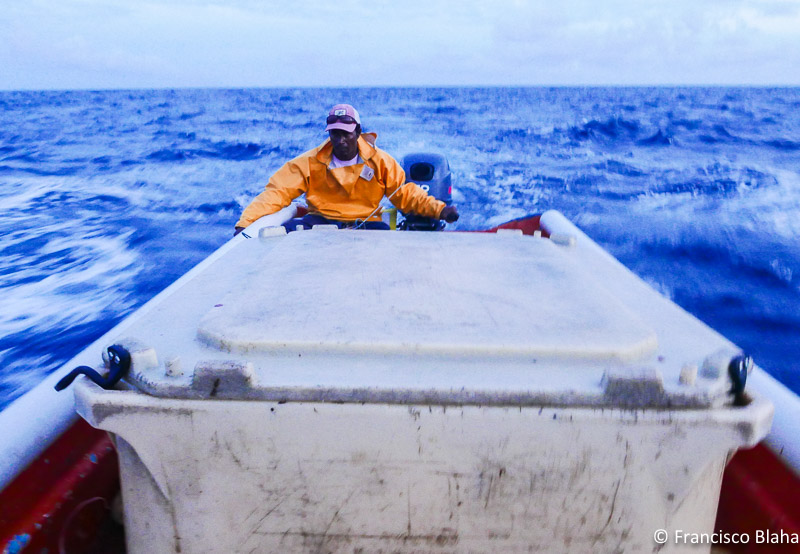
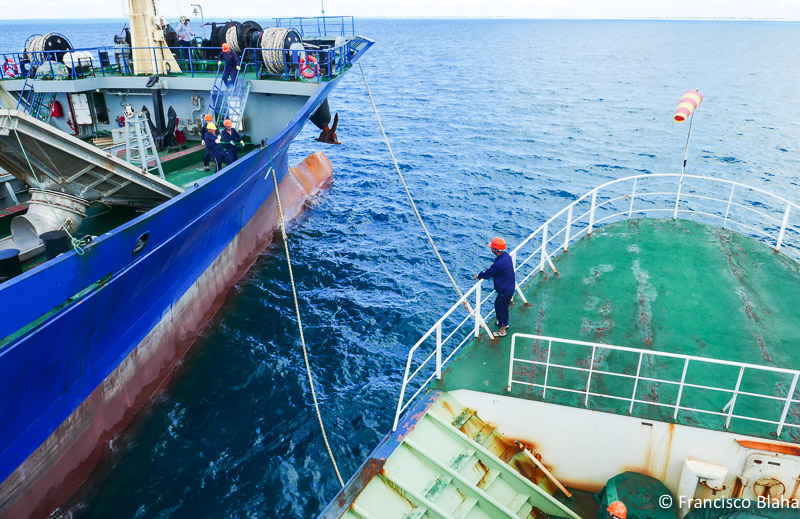
Bunkering it's a rather complex manoeuvring highly dependent on weather, ocean conditions and the respective sizes of both ships, the simplest scenario is illustrated here. But I can’t remember any of the ones I been involved with that dint involve at least some fuel spill... but that is another topic i like to study one day.
Bunkering, is also solid business and there are big companies that deal with entire fleets and some smaller ones that are less transparent. Some, like this company, publish where their bunkers are in the Pacific and the world.
As transhipments in at sea, bunkering is regulated, but… While in principle all bunker need to be registered in the WCPFC record of fishing vessels, and then licensed to operate in the countries EEZ, and they have to be reported… not always the system is being followed.
And of course in the High Seas is the responsibility of the flag states, and as you imagine... bunkers tend to be flagged in developing countries with open registries and weak oversight. In fact, bunkers are as necessary to fishing as carriers, which at least tend to have an observer on board, as a fishing support vessel, something way more diffuse in bunkers.
I always had the idea that if were to investigate better the “common factors” approach in port agents, bunkers logistics, and captain networks / afficliations we could get a better understanding of the inside dynamics of the Pacific longlining fleet that is where we have the biggest impact of IUU in the region. But as one band man, not much chance to do research for the love of it and work as a consultant under well defined ToRs... so i keep those ideas packed in my brain and maybe one day i get paid the develop then!
And voila, here is a paper “Chasing the Fish Oil—Do Bunker Vessels Hold the Key to Fisheries Crime Networks? that deals with that issues, yet it uses social network analysis (SNA) a more sophisticated approach that my basic “common factor” idea, and coincidentally I got to meet Jessica Helen Ford (the main author) a few weeks ago in Bangkok.
Interestingly her background is not fisheries, but statistics and organisms movement, so she brings a totally fresh approach to this field… and I just love that, because it challenges you to think differently. Besides been VERY clever she is also really nice and a cool person. So I’m sure I will keep following her work.
As usual, I recommend you read the original she wrote with other two colleagues from CSIRO in Australia, I just quote some of the things I found more interesting.
Abstract
Disentangling fleet activities, therefore, necessitates identifying and understanding how key players or actors function to support or guide IUU activities. In this regard, recent efforts have focused on identifying transshipment activities by finding and following refrigerated cargo (reefer) vessels. We suggest that bunker, or fuel vessels, may provide one solution to understanding and unravelling these IUU networks for two main reasons: they are fewer in number, are known to provide additional support to fishing vessels beyond refuelling. In this respect, bunker vessels are also used to resupply provisions, and crew, thereby facilitating human trafficking and slavery, which is demonstrably rife in certain components of the commercial fishing realm (e.g., long distance or high seas fleets). Here, we illustrate how social network analysis (SNA) could be used as a methodological lens to expose previously clandestine IUU fishing fleet dynamics. Specifically, we highlight the connectedness of a tanker vessel, and several fishing and reefer vessels, in an area in the Southern Indian Ocean that has high levels of fishing and general shipping.
Crime and Social Networks
A considerable amount of literature in criminology and social psychology illustrates the important role that socialization and the surrounding environment play in shaping people's behaviours. While an extensive literature review is beyond the scope of this current project, a key finding from these research domains is that people's behaviors are shaped by their social and natural environment and the people with whom they associate (e.g., Bandura and Walters, 1977; Gordon et al., 2004; Akers, 2009). Understanding the dynamics and mechanisms of information transfer in the social systems or networks that these criminals operate in is therefore vital and can be accomplished with social network analysis (SNA). Broadly, SNA aims to describe and explain the structural patterns and mechanisms that define social relationships between humans (Scott, 2017).
In brief, SNA shows how individuals are joined in a population using various metrics. These range from degree centrality, which counts the connectedness of a node given the number of connections, to more complex metrics such as eigenvector centrality, in which a node's importance is proportional to the centrality score of all its connections (for more information see Mbaru and Barnes, 2017).
Social network analysis has previously been used to understand natural resource governance (e.g., Bodin and Crona, 2009), including fisheries-related topics such as the success of co-management arrangements (Sandström et al., 2014; Alexander et al., 2015), willingness of fishers to enforce sea tenure (Stevens et al., 2015), information diffusion among resource users (Pietri et al., 2009; Mbaru and Barnes, 2017), and recently, to tie fishing practices to ecosystem health (Barnes et al., 2016).
Fuel resupply vessels (bunkers) have been acknowledged as an integral component of the infrastructure needed to maintain IUU fishing (Gianni and Simpson, 2005). However, we propose that the importance of bunker vessels has been underplayed to date, and increased effort should be focused on tracking and monitoring them. In comparison to reefer (refrigerated cargo) vessels, bunker vessels (although fewer in number) are likely more connected than reefer vessels. We propose that tracking their paths and movements should indicate zones of both legal and potential illegal fishing activity.
Here, we apply SNA to illustrate the dynamics, network position, and importance of bunker vessels in a fleet. Social network analysis is a valuable but seemingly unused tool for this type of investigation; it can provide a framework to infer associations and describe a social structure (Farine and Whitehead, 2015), in some cases allowing inference about vessels based on their associates and connections. We demonstrate how it can be applied to fishery fleet dynamics to understand the nature of the connections and the key players in a network.
An Example of Social Network Analysis
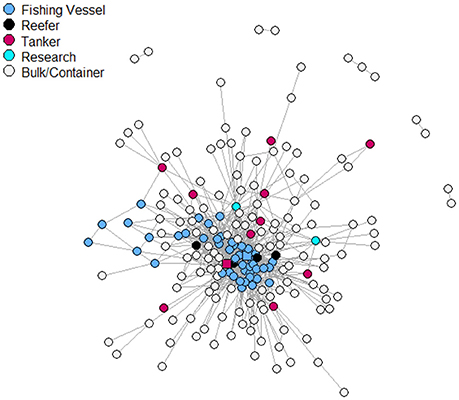
We examined social networks of vessels in a region of the southern Indian Ocean (bounded by Latitude S 25°-S 35° and Longitude E 80°-E 110°) characterized by extensive fishing activity and major shipping lanes transiting to and from Australia. We used 6 months of AIS data, from May to October 2016, in order to demonstrate our application of the methods discussed here. Automatic Identification System was originally developed and implemented for safety as an anti-collision tool and is mandated for all vessels 300GT and over, on international voyages, and all commercial passenger ships (International Maritime Organisation, 1974). There were 181 unique vessels with more than 100 registered AIS transmissions in the region, which included: 119 bulk/container/vehicle carriers, 45 fishing vessels, 11 oil/chemical/liquefied petroleum gas tankers, 4 reefers, and 2 research vessels.
We used iGraph package (Csardi and Nepusz, 2006) in R (R Core Team, 2016) to model an undirected and unweighted network. We considered each of the 181 unique vessel Maritime Mobile Service Identity to be a vertex, and edges were calculated assuming proximity (within 10 km) to other vessels on a given day.
An important point to note here is that we were using movement to infer a social network, so proximity, or potential rendezvous, were assumed to represent interactions, which we were then able to map. In this sense, we were constructing a social network from surveillance data, not from interaction with the actors. There are potential benefits to such an approach, in that it may avoid respondent bias, but also some limitations as it is an indirect measure of the social network. We note that we have used a proximity measure here, and any changes in the assumed connection of nodes will cause variation in results. In addition, due to the purpose and focus of this article, we keep all reference to particular vessels or flag states anonymous.