Among the plethora of papers coming out of via the IAS dataset and some clever data analysis, here is another one that shows and set numbers to things we suspect. This is on a analisys on the activities of the main Distant Water Fishing Nations (DWFN). So, I make it short and sweet (and say a bit about an issue I have with the methodology)

yeah... we fishing here but the money goes that way
Of course read the original: Far from home: Distance patterns of global fishing fleets, and make your own conclusions.
The abstract
Postwar growth of industrial fisheries catch to its peak in 1996 was driven by increasing fleet capacity and geographical expansion. An investigation of the latter, using spatially allocated reconstructed catch data to quantify “mean distance to fishing grounds” found global trends to be dominated by the expansion histories of a small number of distant-water fishing countries.
While most countries fished largely in local waters, Taiwan, South Korea, Spain, and China rapidly increased their mean distance to fishing grounds by 2000 to 4000 km between 1950 and 2014. Others, including Japan and the former USSR, expanded in the postwar decades but then retrenched from the mid-1970s, as access to other countries waters became increasingly restricted with the advent of exclusive economic zones formalized in the 1982 United Nations Convention on the Law of the Sea.
Since 1950, heavily subsidized fleets have increased the total fished area from 60% to more than 90% of the world’s oceans, doubling the average distance travelled from home ports but catching only one-third of the historical amount per kilometre travelled. Catch per unit area has declined by 22% since the mid-1990s, as fleets approach the limits of geographical expansion. Allowing these trends to continue threatens the bioeconomic sustainability of fisheries globally
Results
Analysis of the mean distance travelled by the industrial fleets of the world’s 20 largest fishing countries between their home countries and the locations where catches were taken illustrates three distinct patterns: rapid and largely continuous expansion (Fig. 1A), early expansion followed by stabilization or retrenchment (Fig. 1B), and limited or no expansion (Fig. 1C). The fishing fleets of Taiwan, South Korea, Spain, and China have continuously expanded their mean distance to fishing grounds by at least 2000 km since the 1950s, with the first three of these now fishing, on average, more than 3000 km from their home ports (Fig. 1A).
These are globally operating distant-water fleets and flag states, accounting for nearly 20% of the global industrial catch over the last decade (Fig. 1A). Spain was already fishing, on average, nearly 1500 km from home at the start of global data records in 1950 (Fig. 1A), largely driven by the country’s long history of fishing for Atlantic cod off the Canadian east coast. Five countries or former countries that currently account for about 27% of global industrial catches showed expansion during the early postwar decades but appear to have curtailed or consolidated their distant-water operations since then (Fig. 1B). This includes the former USSR, which had a large distant-water fleet during the 1950s and 1960s, operating, on average, more than 2000 km from home. In scale and early timing of expansion, the former USSR is only exceeded by Spain, South Korea, and Japan (Fig. 1, A and B).
However, while Spain and South Korea have continued a fairly monotonic expansion, the countries of the former USSR began to retrench in the 1970s. Japan, after rapid postwar industrial expansion, also consolidated its fishing effort within the Indo-Pacific region starting in the 1970s (Fig. 1B). The remaining 11 of the 20 largest fishing countries, accounting for 33% of global industrial catches, have shown little or no expansionist efforts over the last 65 years (Fig. 1C).

Fig. 1 Trends in the distance traveled to fish from 1950 to 2014.
Norway has begun to fish relatively further afield in recent years, likely driven by the rapid growth in contribution of its Antarctic krill (Euphausia superba) fishery from<1% of the national total catch in 2006 to 7% in 2014 (www.seaaroundus.org). For the top 20 fishing countries, catches caught on the high seas or in the EEZs of other countries grew by more than 600% between1950 and 2014, increasing their contribution to global catches from16 to 23% over this period (www.seaaroundus.org). Catches by distant-water or“foreign” vessels have therefore grown faster than catches by countries within their own waters, illustrating the increasing importanceof distant-water fishing among the countries that supply most of the world's wild-caught seafood.
Driven strongly by the trends in fishing distance among the 20 largest fishing countries, the net effect since 1950 is a global doubling of the mean distance fished from port (fig. S1). However, this net expansion has been associated with a strong decline in the catch obtained per kilometre travelled over the 65-year time period. Catches declined from more than 25 metric tons per 1000 km travelled in the early 1950s to approximately 7 metric tons per 1000 km travelled by 2014 (Fig. 2).
The global industrial fishing catch increased fivefold between 1950 and its peak of 100 million metric tons in 1996 but has declined steadily by around 18% over the two decades since (Fig. 3A). In contrast, the percentage of total ice-free ocean area used for industrial fishing increased rapidly from 60 to 90% during the 1950s and 1960s, plateaued through the mid-1990s, and has expanded by less than 5% in the last two decades (Fig. 3B). The combination of these two patterns suggests that industrial catch per unit area of ocean fished expanded through peak catch in 1996 but has since declined by 22% (Fig. 3C)
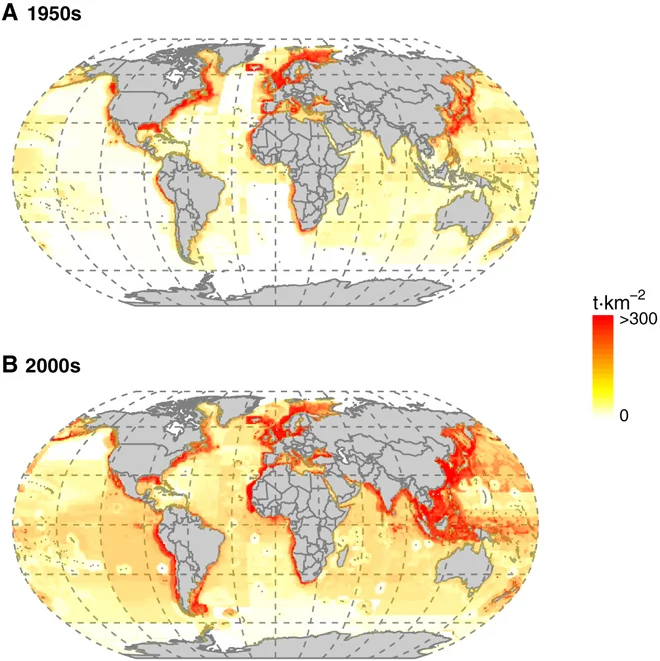
Fig. 4 Spatial mapping of the distribution and intensity of industrial fishing catch. Mean industrial fisheries catch in metric tons per square kilometer by catch location during the (A) 1950s and (B) 2000s.
---
I find very illustrating graph 1 as it represent what I have seen worldwide, and I like the sentiment of the paper. Yet, the author's headline-grabbing line stated that the total fished at the present is more than 90% of the world’s oceans. But that's only if you count one catch in every 1/2° × 1/2° latitude and longitude cell as "fished" (That is 51km x51km). So, the smaller the grid (cells) the less of the ocean is fished. If each cell is 1 ocean, 100% has been fished, if is cell is a 1cmx1cm most would be unfished?
Furthermore, a lot of transit and drifting happens, which is not fishing. When I analyse VMS tracks you see that there is a lot of ocean navigated but not fished.
Maybe "90% of the oceans have been navigated by FV when we divide the oceans in 51x51 km grid cell be more accurate, but them... surely less headline-grabbing.