And the IAS dataset papers just keep coming, and here one that that put focus on High Seas longliners activities and bring all sets of well grounded reasons on how and why they operate there. As the cheap shot I am, I share my colleague Tim Adams opinion: is the refuge for the cheap operators. There is no license to pay to fish on the high seas, their flag state pays their contributions to the RFMOs and they provide high seas permits like if they are free candies. That is motivation enough to hang out there.

I find the graphs showing the concentration of the longline effort on the edges of the Pacific Islands Countries EEZ's, where they fish without paying anything, really upsetting but that is the reality, and that "transparency" is perhaps the biggest contribution of all these IAS based papers. (I also find upsetting that they cat the Pacific in half and all these fisheries maps are "Atlantic centric", but that is a different topic)
Anyway, as usual, read the paper "The environmental niche of the global high seas pelagic longline fleet" and draw your own conclusions, I quote below some of the parts I like.
Abstract
International interest in the protection and sustainable use of high seas biodiversity has grown in recent years. There is an opportunity for new technologies to enable improvements in management of these areas beyond national jurisdiction. We explore the spatial ecology and drivers of the global distribution of the high seas longline fishing fleet by creating predictive models of the distribution of fishing effort from newly available automatic identification system (AIS) data. Our results show how longline fishing effort can be predicted using environmental variables, many related to the expected distribution of the species targeted by longliners. We also find that the longline fleet has seasonal environmental preferences (for example, increased importance of cooler surface waters during boreal summer) and may only be using 38 to 64% of the available environmentally suitable fishing habitat. Possible explanations include misclassification of fishing effort, incomplete AIS coverage, or how potential range contractions of pelagic species may have reduced the abundance of fishing habitats in the open ocean.
Results
High seas longline fleet composition and distribution
After analyzing all satellite-based AIS fishing effort data from GFW, we found that longline fishing effort in the high seas accounted for 84 to 87% of the fishing effort (by hour) across gears during the study period (fig. S1). While longline fishing effort is lower in ABNJ, it represents a major top-down pressure on oceanic ecosystems (27). Of the high seas longline fishing effort, 88.9% (2015) and 80.4% (2016) were attributable to five fishing States or territories: China, Japan, South Korea, Spain, and Taiwan (fig. S2). Taiwan dominates global longline fishing effort (by hour) in the high seas, followed by Japan, Spain, China, and South Korea. Our analysis focuses on these top-five fishing States or territories. AIS-derived fishing effort data show that the distribution of longline fishing effort in the high seas changes across space (Fig. 1) and time (Fig. 2). During 2015 and 2016, the tropical (23.5°N to −23.5°S) and temperate (66.5°N to 24.5°N and −24.5°S to −66.5°S) regions contained 64.6 and 35.3% of the global fishing effort, respectively. On average, the intensity of fishing effort in the high seas is higher during the boreal summers and peaks in July and August during 2015 and 2016, respectively (Fig. 2). The overall increase in fishing effort data between years is likely driven by an increase in the number of orbiting satellites capable of detecting AIS signals, as well as an increase in the capability of detecting and classifying longline fishing effort by the GFW group. Despite the increase in fishing effort intensity, the seasonal pattern where global longline fishing effort increases during the boreal summer months seems to be preserved between the two years. Untangling the drivers of the observed seasonal patterns of fishing effort requires a regional, fleet-specific approach that includes information about target species, fishing seasons, and quotas. All fishing effort data needed to evaluate the conclusions in this paper are available from GFW.

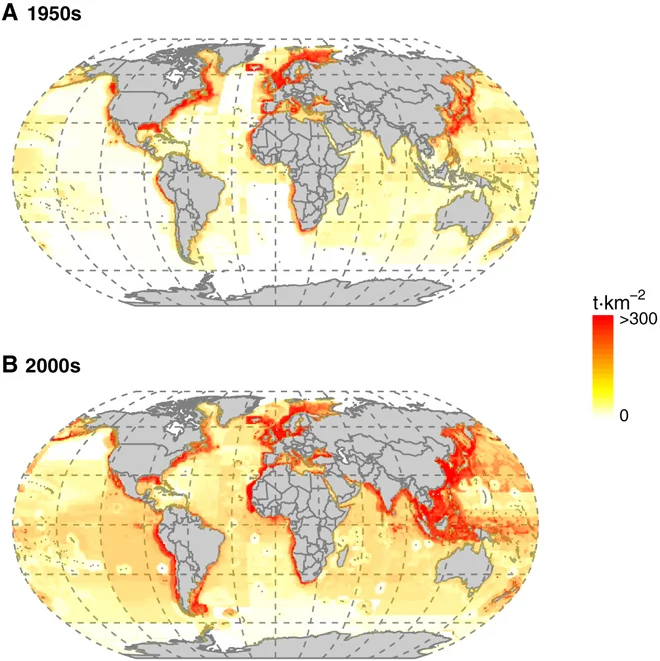
Fig. 1 Distribution of global pelagic drifting longline fishing in ABNJ in 2015 and 2016. (A) 2015. (B) 2016. Light gray areas depict exclusive economic zones (EEZs) that were excluded from this study.
Monthly persistence maps provide a visual representation of the global changes of fishing habitat suitability throughout the year (Figs. 3 and 4) and help identify areas of the high seas where favorable environmental conditions for longline fishing are most stable. The monthly persistence maps also help identify areas of the high seas that are not classified as environmentally suitable for longline fishing throughout the year, which provides valuable information about which areas may be experiencing less longline fishing pressure.

CONCLUSIONS
As we combine an improved understanding of open-ocean fleet behavior with knowledge of the drivers of distribution of target and nontarget marine taxa, our ability to predict the co-occurrence of fishing with sensitive species or ecosystems will improve, as will the efficacy of related management measures. As the intensity and overlap of human uses of ABNJ continue to grow, ocean governance structures will have to rely more heavily on different forms of dynamic spatial management to accommodate all users and activities, which, in turn, rely on open-access remote sensing data and collaborations between researchers, fishers, and the management community Our research demonstrates how the global pelagic longline fleet exhibits predictable environmental preferences for various biophysical and physiographic predictors, which can be used to explore the current and future distributions of fishing fleets. Improvements in remote sensing and oceanographic forecasting for variables (for example, SST) open new opportunities for the implementation of adaptable ocean management measures that match the dynamics and distributions of ocean biological resources and resource users. As we grapple with rapidly changing oceans and ocean uses, advancements in predictive modeling, aided by new technologies, will help us move away from reliance on retrospective tactics in area-based management and toward more dynamic approaches capable of delivering ecosystem-based management.