Overview of Tuna Fisheries in the WCPO, including Economic Conditions, for 2017 by Francisco Blaha

What do 2,539,959 Tons of tuna look like?

One thing that never ceases to amaze me from working in the WCPF tuna fisheries, is the vastness and sometimes “incommensurability” of the numbers we work with. Just forgets for the moment we have 17 PS and 9 Carriers in the lagoon… that is a lot in Pacific terms, but not much for other fisheries. But the volumes of fish we (via SPC) estimate is being caught is just mind-blowing.

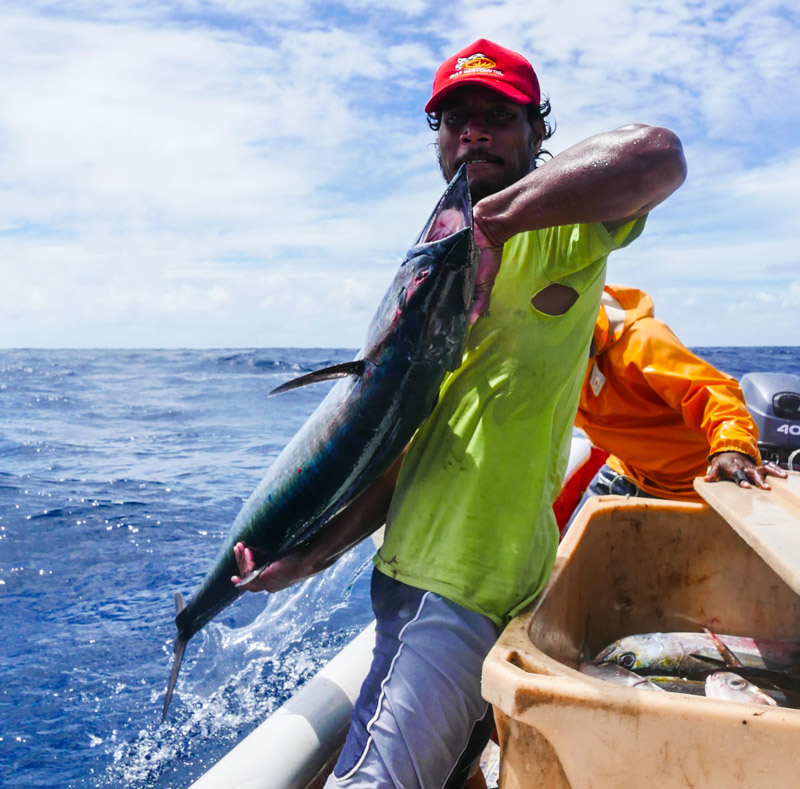
Definitivelly not the guys gettingUS$3.40 billion

Definitivelly not the guys gettingUS$3.40 billion

Among the many papers we have in TCC, I just quote below the abstract of a paper by my friend and colleague Peter Williams from SPC (one of the people I respect the most in the tuna world) and Chris Reid from FFA. “Overview of Tuna Fisheries in the Western and Central Pacific Ocean,including Economic Conditions 2017”, as usual: read the original.

This paper provides a broad description of the major fisheries in the WCPFC Statistical Area (WCP-CA) highlighting activities during the most recent calendar year (2017) and covering the most recent summary of catch estimates by gear and species. 

The provisional total WCP–CA tuna catch for 2017 was estimated at 2,539,950 mt, the lowest catch for six years, and around 340,000 mt below the record catch in 2014 (2,883,204 mt). The WCP–CA tuna catch (2,539,950 mt) for 2017 represented 78% of the total Pacific Ocean catch of 3,239,704 mt, and 54% of the global tuna catch (the provisional estimate for 2017 is 4,715,836 mt, at this stage, the fourth highest on record). 

The 2017 WCP–CA catch of skipjack (1,624,162 mt – 64% of the total catch) was the lowest since 2011, at nearly 375,000 mt less than the record in 2014 (2,000,608 mt). 

The WCP–CA yellowfin catch for 2017 (670,890 mt – 26%) was the highest recorded (more than 35,000 mt higher than the previous record catch of 2016), mainly due to increased catches in the purse seine fishery. 

The WCP–CA bigeye catch for 2017 (126,929 mt – 5%) was the lowest since 2016 and mainly due to continued low longline catches. 

The 2017 WCP–CA albacore catch (117,969 mt – 5%) was slightly lower than the average over the past decade and around 50,000 mt lower than the record catch in 2002 at 147,793 mt. 

The south Pacific albacore catch in 2017 (92,291 mt) was a record catch, primarily due to a record in the longline fishery (89,388 mt.); the 2017 catch was around 4,000-5,000 mt. more than the previous record catch in 2010 of 88,147 mt. 

The provisional 2017 purse-seine catch of 1,812,474 mt was slightly less than the most recent five-year average, and nearly 250,000 less than the record in 2014 (2,059,008 mt). While the total purse seine catch in 2017 was similar to the 2016 catch level, the species composition was clearly different.

The 2017 purse-seine skipjack catch (1,280,311 mt; 71% of total catch) was the lowest since 2011 and nearly 350,000 mt lower than the record in 2014.

In contrast, the 2017 purse-seine catch estimate for yellowfin tuna (472,279 mt; 26%) was the highest on record at nearly 50,000 mt higher than the previous record (423,788 mt in 2008); this record was mainly due to good catches of large yellowfin from unassociated-school set types in the west and central tropical WCP-CA areas (see Figure 3.4.8–right).

The provisional catch estimate for bigeye tuna for 2017 (56,194 mt) was a decrease on the catch in 2016 and lower than the most recent five-year average. 

The provisional 2017 pole-and-line catch (151,232 mt) was the lowest annual catch since the mid-1960s, with reduced catches in both the Japanese and the Indonesian fisheries. 

The provisional WCP–CA longline catch (240,387 mt) for 2017 was lower than the average for the past five years. The WCP–CA albacore longline catch (96,280 mt – 40%) for 2017 was higher than the average catch over the past decade, and only 5,000 mt lower than the record of 101,816 mt attained in 2010.

The provisional bigeye catch (58,164 mt – 25%) for 2017 was the lowest since 1996, presumably mainly due to continued reduction in effort in the main bigeye tuna fishery.

The yellowfin catch for 2017 (83,399 mt – 35%) was lower than the average for the past decade and more than 20,000 mt less that the record for this fishery. 

The 2017 South Pacific troll albacore catch (2,508 mt) was similar to catch levels experienced over the past four years. The New Zealand troll fleet (111 vessels catching 1,952 mt in 2017) and the United States troll fleet (13 vessels catching 556 mt in 2017) accounted for all of the 2017 albacore troll catch. 

Market prices in 2017 generally improved with significant increases in prices for purse seine caught skipjack and yellowfin, pole and line caught skipjack and longline caught yellowfin, swordfish and striped marlin while longline caught albacore prices remained steady and longline caught bigeye prices were either steady or declined.

The total estimated delivered value of catch in the WCP-CA increased by 12% to US$5.84 billion during 2017

The value of the purse seine catch (US$3.40 billion) accounted for 58% of the value of the catch, the fishery’s 2nd highest contribution to total catch value. 

The value of the longline fisheryin 2017 (US$1.46 billion) was the lowest since 2007 and accounted for 25% of the value of the catch, its 2nd lowest contribution to total catch value. 

The 2017 values of the pole and line, and other catch were US$348 and US$631 million respectively. 

The value of the 2017 WCP–CA skipjack catch(US$2.98 billion) was the equal to the third highest recorded and 13% higher than 2016. 

The 2017 value of the WCP–CA yellowfin catch(US$1.9 billion) was the second highest recorded and 17% higher than 2016. 

The value of the WCP–CA bigeye catch in 2017 (US$0.65 billion) was at its lowest level since 2005. 

The 2017 value of the WCP–CA albacore catch (US$0.34 billion) was around that averaged over the past 10 years. 

Economic conditions in the purse seine, tropical longline and southern longline fisheries of the WCP-CA showed mixed results. The southern longline fishery saw a further improvement in catch rates which drove the FFA economic conditions index to its highest level since 2009. 

Conversely, the tropical longline fishery index, which moved above its long term average in 2016 for the first time since 2010, fell back to below the long term average. 

In the purse seine fishery, despite significant falls in purse seine catch rates, higher prices resulted in the continuation of the good economic conditions in 2017, with the FFA purse seine fishery economic conditions index increasing marginally from 2016 to be at its third highest level since 1999.

A Review of High Seas Transshipment occurring within the WCPFC by Francisco Blaha

I has been a busy few days at this TCC, I’m doing my day job and working on PSM with the barding officers, and then when finished coming over the TCC meeting. Is a very interesting dynamics going on there, none than I’m either used too or really like.

Wealth transfer

Wealth transfer

The bit shocked me the most is that all the observers (NGOs and even FAO) get kicked out of the plenary before the reports of not compliance  gets discussed, as if it was to be said there is not known. Most of the non-compliance relate to the DWFN and the ones of the PIC flag state are overwhelmingly focuses on those vessels have beneficiary ownership on those DWFN. I don't really get it, but then is not my job to get it. Yet for me, transparency is transparency… end of story.

Anyway, the process itself is a bit frustrating for me, people seems to argue more about words than outcomes (I always struggle with that, and I think is biassed against those that not have English as a first language). In any case I’m learning a lot while in the room. Decisions being made here, are the ones that then front line compliance people and those advisers like me, have to put in place.

By doing boardings in the mornings and assisting to the discussion on the afternoons, the contrast could not be starker.

In any case, there is a lot to read… and among the plethora of interesting things to read, there are a few that caught my attention, but among them this one is quite illuminating: A Review of Management and Reporting Trends Related to Transhipment Occurring within the WCPFC Submitted by Pew Charitable Trusts WCPFC-TCC14-2018-OP03. 

I quote here some of the most interesting aspects (at least for me) of the paper, the link above if for the intranet, but I been assured by Pew Staff that is open and available. 

As indicated through the WCPFC Secretariat Annual Report on Transshipping, the number of reported high seas transshipment events has increased by 97 percent between 2014 (552 events) and 2017 (1,089 events). The number of transshipping vessels has also increased; in 2018, 55 percent of fishing vessels on the WCPFC Record of Fishing Vessels (RFV) were authorized to transship on the high seas, a significant increase from the 40.5 percent seen just three years ago in 2015. A robust analysis of transshipment data, however, is difficult because information regarding transshipment is diffuse, spread out between multiple reports, and tends to be inconsistent between reporting sources.

 The data and trends clearly illustrate the need for additional management rules on transshipment in the WCPFC Convention Area to ensure full and effective control and monitoring of these activities and to reduce the opportunities for illegal fishing and the introduction of illegal caught fish into the seafood supply chain. Several specific recommendations are included at the end of the paper.

Key Issues

1. The Size of Carrier Fleets and Number of High Seas Transshipment Events is Increasing

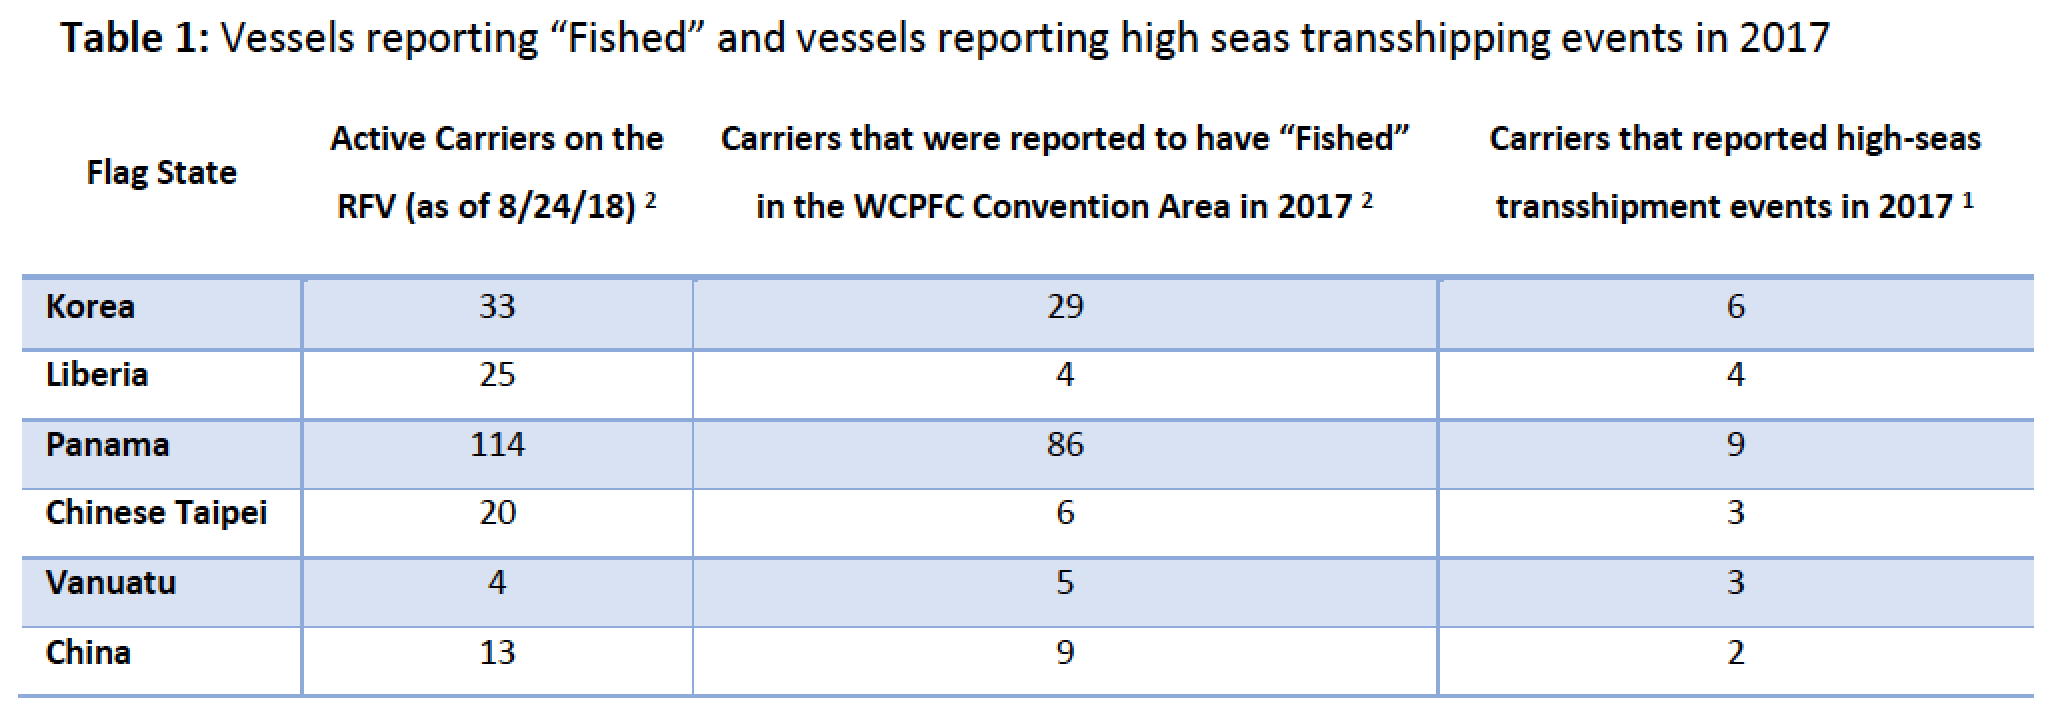
By August 2018, Panama’s active authorized carrier vessel fleet on the RFV grew to 114 vessels, followed by Korea (33 vessels), Liberia (25 vessels) and Chinese Taipei (20 vessels). Between 2014 and 2017 the number of Panamanian flagged carriers reported to have “Fished” in the Convention Area increased by 56% (55 vessels to 86 vessels). Between 2016 and 2017, Chinese Taipei flagged vessels increased the number of their reported high seas transshipment events by 82 percent for offloading vessels (290 to 529 events) and by 80 percent for receiving vessels (113 to 204 events). During that same period, Korean flagged carriers also increased receiving vessel reporting of transshipments by 112 percent (94 to 200 events).

Table 1 below summarizes the number of carrier vessels reported by each CCM to have “Fished” in the Convention Area in 2017 and the number of carriers that reported high seas transshipping events as per the 2018 WCPFC TCC Annual Report on Transshipment (RP03). The difference between the number of carriers that operated in the Convention Area in 2017 (139 carriers) as opposed to the number of carriers that reported high seas transshipping events (27) should be noted. There is very little transparency or reporting on the regional level of the operation of the remaining 112 carriers, which represent over 80 percent of the entire carrier fleet, that were reported to have “Fished” in the Convention Area in 2017 by their flag State CCM but did not report high seas transshipment events. In order to provide a full accounting of all the activities of carriers that operate in the Convention Area, carrier vessels should be required to provide all transshipment reports and declarations to the Secretariat regardless of where the transshipping event occurs (high seas, EEZ, or in port).

Screen Shot 2018-09-29 at 10.59.51 AM.png

2. There is Insufficient Sharing of Data Regarding WCPFC, IATTC, and NPFC Transshipment Operations 

Due to the lack of an agreement between the WCPFC and the IATTC carrier observer service provider on transshipment observation, nearly 11% of transshipments that were reported to have occurred in the WCPFC Convention Area on carriers carrying an IATTC observer were not observed in 2017, despite the presence of an IATTC observer. The sole reason for this appears to be because a vessel captain is allowed to have the discretion whether an event is observed or not. These unobserved events, totaling 50 separate events with an average weight of transshipment of 56.03 metric tons, potentially represents over 2,800 metric tons of WCPFC product that went unreported by weight and species in 2017 3. To ensure that all transshipping events occurring in the WCPFC Convention Area be observed, documented, and reported directly to the WCPFC Secretariat, and to prevent the delegation of decision-making on transshipment monitoring to vessel masters in the future, the current data-sharing agreement between WCPFC and IATTC should be extended to cover MRAG Americas, the IATTC carrier observer service provider.

Additionally, it appears there is no specific mention of the 413 events WCPFC transshipment events that were observed by IATTC observers in 2017 included within the 2018 WCPFC TCC Annual Report on Transshipment (RP03). As such, it is unknown if the WCPFC Secretariat has received information from IATTC on these events and whether this information was included in the Annual Report. If these transshipments have not been included, the Secretariat should be tasked with updating RP03 to include this information, including a clear delineation of the additional number and flag of offloading and receiving vessels involved in transshipping in the WCPFC Convention Area and the amount of product transshipped.

Screen Shot 2018-09-29 at 11.02.37 AM.png

3. Carrier Observer Reports Are Not Being Submitted to the Secretariat 

The 2018 WCPFC TCC Annual Report on Transshipment (RP03)1 does not include any information about reports received by the Secretariat from observers, despite the fact that CMMs have indicated full observer coverage of all 1,089 reported transshipment events*. In 2017, the Secretariat reported at TCC13 (paragraph 203 of the TCC14 Meeting Summary Report)4that they had received only one observer report for the 956 high seas transshipping events that were reported to have occurred in the Convention Area in 2016. To allow for independent verification of transshipment related data received from carrier vessel transshipment declarations, TCC14 should recommend that the Commission revise the WCPFC Regional  Observer Programme (ROP) Standards and Guidelines document to mandate that observers document all transshipment events occurring on the high seas in the WCPFC Convention Area and submit these observer reports directly to the Secretariat. 

4. Discrepancies Existing in the Number of Transfers Reported by Offloading and Receiving Vessels 

The 2018 WCPFC TCC Annual Report on Transshipment (RP03)1 reveals discrepancies in notifications and declarations received from offloading and receiving vessels. For instance, the report indicates that Panamanian carriers were involved in 280 high seas transshipment events in 2017, yet only 210 notifications and 202 declarations were received from the carriers1. Small inconsistences occur with three other flag States. These inconsistencies are also found in the information provided by CCMs on transshipment within their Annual Report Part I submissions5. For example, Panama’s 2018 Annual Report Part I indicated only 15 high seas transshipment events occurred in 2017 (as compared to the 280 high seas events reported in RP03). Liberia reported 243 events in their Annual Report Part I (without a breakdown of where the events occurred – high seas, EEZ, or outside the Convention Area - although they reported the events occurred in all these locations). Korea reported 168 high seas events (as opposed to 200 high seas events in RP03). Vanuatu reported 270 high-seas transshipping events without a breakdown of how many involved offloading or receiving vessels. China reported one carrier to have conducted high seas transshipment (as opposed to two carrier vessels in RP03). Chinese Taipei provided no information in their Annual Report Part I regarding transshipping events involving their carrier vessels.

Table 3 summarizes data outlined within CCMs Annual Report Part I, the number of carrier vessels that conducted transshipments in 2017 as well as the location where these transshipment events took place (high seas, EEZ, in port). Four out of these six flag States did not provide the number of carrier vessels that conducted transshipment in 2017. In addition, four of the six did not specify the location of their transshipment events. One did not provide any information at all about carrier vessels and only reported on “offloading” vessels.

Screen Shot 2018-09-29 at 11.04.19 AM.png

Without infringing upon the national laws of any coastal State, the Commission should mandate consistent transshipment reporting requirements for all transshipping events within the Convention Area, regardless of where the event occurs, including those that take place in port and within EEZs. This would allow the Secretariat to have a clear overall picture of all transshipping events occurring within WCPFC waters during a specific calendar year. 

5. Additional Sources of Information Are Needed to Effectively Verify Reported Transshipment Operations 

According to the 2018 WCPFC TCC Annual Report on Transshipment (RP03)1, the Secretariat undertook an analysis of VMS data to attempt to detect potential transshipment events, specifying that an incident would be counted as an event when “…the reported WCPFC VMS positions related to two fishing vessels, are estimated to be within a distance of 250 meters, over a time period of at least 4 hours…”. Despite only 23% of the over 1600 transshipment events that were reported to the Secretariat during that period being detected, the Secretariat should be applauded for this initiative. In order to improve the accuracy of the tool, the Secretariat should consider data from the ICCAT and IOTC carrier observer programmes, which indicate that the vast majority of transshipment events at sea in those regions are completed in less than three hours. Observer report analysis and stakeholder input are key resources the Secretariat can utilize to improve the effectiveness of the WCPFC Transshipment Analysis Tool and increase the overall detection rate. Another valuable tool is the use and analysis of Automated Identification System (AIS) data. Given that the VMS polling rate for longliners is once every four hours, AIS could be used to gain a better understanding of the length of time a transshipment at sea takes place within the WCPFC Convention Area that VMS cannot do due to the length of time between polling. TCC14 should recommend that the Secretariat consider modifying its detection criteria and be allowed to conduct a demonstration on the usefulness of AIS as a supplement to VMS and other reporting data over the next year, especially as it relates to transshipment reporting. 

In order to standardize the data submitted by CCMs on transshipment operations, the Secretariat has created the template in Annex 3 of RP031 for use by all applicable CCMs when submitting their Annual Report Part I. TCC14 should approve this template with the addition of data fields that clearly outline the number of offloading and receiving vessels involved in transshipping in the Convention Area as well as the number of events for each by location (high seas, EEZ, in port).

Considerations: 

This analysis clearly demonstrates the need for management reform of transshipment in the WCPFC Convention Area. The Pew Charitable Trusts has developed best practices related to transshipment management aimed towards maximizing transparency and minimizing the potential for IUU fish to be laundered into the market. Oversight of transshipment can be improved in WCPFC by implementing these best practices in three main areas: 

  • Reporting - The current WCPFC transshipment measure (CMM 2009-06) should be strengthened to include consistent transshipment reporting requirements to all areas within the Convention Area, including all transshipments that occur in port and within EEZs. This will allow the Secretariat to receive a complete picture of transshipment activity that occurs within the WCPFC Convention area. 

  • Monitoring –The template provided by the Secretariat in Annex 3 of RP03 should be expanded to include additional data fields on number of offloading and receiving vessels involved in transshipping and locations of where transshipping events occurred (high seas, EEZs, in port). This will allow cross-verification of vessel transshipment reporting. In addition, the ROP Standards and Guidelines document should be revised to mandate the submission of observer reports to the Secretariat for all high seas transshipments occurring within the WCPFC Convention Area to facilitate the ability for the Secretariat to review, cross-verify and validate transshipment information. 

  • Data sharing – The Commission should establish formal transshipping data-sharing procedures with the North Pacific Fisheries Commission and expand the current data-sharing agreement with IATTC to include the ability for the IATTC carrier observer service provider (MRAG Americas) to share information directly with WCPFC for any transshipment taking place on the high seas in the WCPFC Convention Area involving a carrier vessel with an embarked IATTC observer. 


References:

1. Annual Report on WCPFC Transshipment Reporting with an Emphasis on High Seas Activities (WCPFC-TCC14-2018-RP03) https://www.wcpfc.int/node/31649

2. WCPFC Record of Fishing Vessels History as of 24 August 2018 https://www.wcpfc.int/doc/historical-record-fishing-vessels-rfv-data

Corporate Dynamics in the Shelf-stable Tuna Industry by Francisco Blaha

If you want to understand the tuna industry, don’t look at the harvesting side only, since it will give you only a small view of a much bigger picture. The tuna industry is very particular, since does not only has the usual “States” (flag, coastal, port, market), the “new” one (processing state), but then two unique “supra states”: the traders (FCF, Trimarine and Itochu) and the main Brands, and their influence goes down the value chain “big time”.

this crew in the solomons, is actually the only one I know that best benefit from their product

this crew in the solomons, is actually the only one I know that best benefit from their product

This latest FFA report by my colleagues Elizabeth Havice and Liam Campling, gives us a very detailed view on the main brads, that “far end” aspect of the tuna world, to people like me at the 1st steps in the value chain. 

As all of their work I’ve read, this one is good stuff. I quote here the executive summary. but as usual read the original!

This report provides FFA members with industry and market intelligence on the current status of the shelf-stable (e.g. canned) tuna processing industry. It offers a global overview of processing capacity (providing data on volume and value of activities), new developments and key issues shaping the sector. It then conducts a focussed analysis of five case-study firms (three ‘major’ and two ‘minor’) to demonstrate the range of industry dynamics currently in play in the sector and to draw out implications for Pacific Island countries.

The case study firms are: Thai Union, Dongwon Industries and Dongwon F&B, Bolton Foods, Princes, and Bumble Bee. Primarily through desk-based research, the analysis details operations, ownership and management structures, vertical integration such as brand ownership, mergers and acquisitions (M&A), major markets, financial performance, sustainability and labour initiatives, recent changes and future developments, WCPO business interests and links with Pacific Island countries. 

Global Overview and Key Developments 

Between 2008 and 2017, global tuna processing capacity (whole round and cooked loins) increased 12-13%. Over the same period, the total number of processing plants increased from 144 to at least 215. Whole round fish represents around 85% of raw material throughput and frozen cooked loins account for around 15%. Loins are mostly used by processors in the US mainland, Spain and Italy. Estimated global canned tuna processing capacity is around 13,700mt/day, requiring around 3 million mt of whole round fish (skipjack, yellowfin and albacore). In 2017, the top five canned tuna processing countries by volume were: 1) Thailand (3,490 mt/day); 2) Ecuador (1,635mt/day); 3) Spain (1,275 mt/ day); 4) Mexico (725 mt/day); and, 5) Philippines (510 mt/day). 

Thailand remains the world’s largest canned tuna processor, accounting for around 15% of production. Thailand does not have a significant tuna fishing fleet and so relies heavily on raw material imports, mainly from the WCPO, which exposes Thailand-based processors to risk during periods of high tuna prices. 

The European Union is the world’s largest market for canned tuna. The market is supplied by producers inside the EU, mainly Spain (67%) and Italy (21%), and by imports, especially from countries with duty free access. The top three foreign suppliers are Ecuador, Seychelles and Mauritius. Import volumes from the Philippines and from Papua New Guinea have increase by 48% between 2013-2017. PNG and Solomon Islands loin imports accounted for, respectively, 9% (12,093mt) and 5% (6,477mt) of the EU’s total loin imports; volumes sourced from Solomon Islands, largely for Italy, grew 64% between 2013- 2017. Given that the UK is Europe’s largest imported canned tuna market, there is concern that Brexit might have a negative impact for exporters accessing that market. 

The United States remains the second largest shelf-stable tuna market. The market is supplied by two canning-only plants (i.e. that import frozen loins) in the mainland and from the US territory American Samoa, where whole round is also processed, and by finished goods imports from around 35 countries. The top three foreign suppliers are Thailand, Ecuador and Vietnam. Frozen cooked loin import volumes have declined since 2013, with Fiji as a significant supplier of albacore loins in the range of 11,000-12,000mt/year. 

Canned tuna processors continue to intersect with several long-standing concerns. The industry continues to struggle with overcapacity, with a majority of plants continuing to operate below full capacity, while new plant investments and expansions continue. Cyclical, short-term raw material price volatility continues to place pressure on processors in periods of higher prices, especially those that are not backward integrated into trading or fishing. Efforts to strengthen tuna fisheries management across all four ocean basins have not yet yielded long-term tightening of raw material supplies and associated long-term fish price increases. Canned tuna processors continue to face increased costs of key production inputs such as cans and ingredients such as olive oil; such costs are largely absorbed by processors because of the difficulty of passing cost increases on to consumers. The global canned tuna industry has continued to consolidate through mergers and acquisitions (M&A), which have taken place within the tuna and other seafood sectors and for both shelf-stable and frozen products. The rate of M&As is expected to slow as the most attractive deals have been completed or blocked by anti-trust regulation. Supermarkets continue to dominate retailed canned tuna sales globally, with private label brands providing strong price competition to national brands

A number of countries with significant canned tuna and frozen cooked loin processing capacity that compete with Pacific Island processors in the EU market have concluded or are in negotiations for preferential trade agreements with the EU. The Philippines and Ecuador have gained duty free access to the EU and Vietnam has secured a quota for canned tuna and gradual liberalization of loins. Negotiations between the EU and Thailand, ASEAN countries and Indonesia are in various stages. The EU continues to issue IUU yellow cards as warnings that lack of compliance with the terms of the IUU regulation could lead to suspended market access. In the Pacific, Fiji, Solomon Islands, Vanuatu, PNG and Tuvalu have been issued yellow cards and subsequently had them lifted when compliance was demonstrated. 

Several developments have emerged in recent years. Initiatives related to sustainable fisheries, supply chain transparency, and ethical labour are now permanent fixtures in the industry, though each initiative varies in scope and aims. Processors and brand owners are developing innovative and value-added product lines that use less tuna raw material to combat high raw material prices and meet changing consumer preferences. Some processors are diversifying into high-quality pet food production to expand into new market segments and improve profitability. Firms are diversifying packaging materials and marketing channels (e.g. online platforms) to improve returns and reach new markets. 

Case Study Firms 

Thai Union is the largest tuna company in the world. Its business is focussed on three seafood divisions: shelf-stable seafood; frozen and chilled seafood and related products; and, pet care and other ‘value added’ products. Thai Union’s business model is highly dependent on tuna and ensuring stability of tuna supply is critical for the firm. It is not backward integrated into fishing, so to stabilize supply it maintains a large raw material inventory in cold storage and has recently developed a Global Procurement Team to centralize its purchasing power. 

Thai Union’s core business is the manufacture of seafood for its own brands and as a private label processor for clients. It owns extensive processing operations in Thailand that contribute to a total of 17 production facilities in North America, Europe, Africa and Asia. Over the last 20 years, one of Thai Union’s key corporate strategies has been to forward integrate into brand ownership, notably with the purchase of Chicken of the Sea (1997) and MW Brands (2010). Forward integration has enabled Thai Union to capture a greater proportion of value through brand rents. Thai Union’s major markets are the US, Europe, Thailand and Japan, with 15% of total sales made in emerging markets. Thai Union is expected to look to organic growth, selective M&As, and product diversification to boost sales and growth. Thai Union is emerging as a leader in environmental and social responsibility, internalizing environmental and labour commitments and procedures and investing significant financial and human resources into monitoring and compliance. 

Thai Union’s principal relationship to the WCPO is in its ongoing dependence on the region for tuna raw material supply, which is facilitated through Thai Union’s long-term relationship with the FCF trading company. Thai Union has increased its processing of co-branded Pacifical canned tuna for Northern European markets and the US market and is well positioned to supply growing demand for ‘sustainable’ canned tuna. Thai Union is a partner in Majestic Seafood Corporation in Lae, PNG, an investment that provides raw material supply to Thai Union, but that has not operated at full capacity. 

The Dongwon Group is a sprawling South Korean industrial conglomerate. Through the inter-connected set of companies that make up Dongwon, the firm has comprehensive backward and forward linkages in the processing value chain and has the capacity to raise money to purchase supporting companies. Two of its subsidiaries are central players in the tuna processing industry. 

Dongwon Industries Co., Ltd. is Korea’s largest deep-sea fishery company, owning 19 purse seine vessels. The firm has focussed on expanding vessel capacity and profitability, building seven new purse seine vessels since 2006, with two additional large vessels scheduled to join the fleet in 2018. These new vessels enhance annual per-vessel catch and are equipped with rapid cooling technologies and facilities to manage sashimi-grade handing and freezing. The vessels supply plants in Bangkok and sister company, Dongwon F&B’s processing plants. Dongwon Industries’ ULT longline fleet primarily supplies Japan for sashimi grade product. Dongwon Industries vertically integrated into brand ownership by purchasing Starkist (2008), the market leader in the in the US, and also owns processing facilities in American Samoa, Senegal and Ecuador. Starkist is also the leader in the higher profit pouch segment of the US market and is expanding into niche marketing and value-added products. Dongwon F&B Co. Ltd is a branded manufacturer that controls 75-80% of the Korean canned tuna market through ownership of over 16 brands and three processing plants. Dongwon F&B has high exposure to raw material price increases; the firm is presently working to expand further into the domestic market and broaden its reach to international markets and develop value-added products, emphasizing the health and convenience of its products. 

The broader Dongwon conglomerate exhibits a high degree of vertical integration, accomplished in part through M&As, where Dongwon’s affiliates integrate with each other and create opportunities for the Group as a whole to expand market and product reach. Strategic M&As that support the Group’s tuna processing business include mergers with or acquisitions of firms that specialize in tin can production for shelf-stable products, logistics, online retailing of ready-made meals, tuna processing and diversified seafood products. Reversing a long resistance to eco-certifications, Dongwon Industries has made several moves into the MSC certification market. Starkist has initiated the MSC process for US flagged longline vessels out of American Samoa, and Dongwon Industries has initiated MSC assessments for its purse seiners in the WCPO (which make a high proportion of sets on free schools) and longline operations in the WCPO and Eastern Pacific Ocean (EPO). 

Dongwon has several important connections to the WCPO. Both Dongwon Industries and F&B are heavily dependent on the WCPO, particularly waters of the Parties to the Nauru Agreement (PNA), for raw material supply, and Starkist has a large processing plant in Pago Pago, American Samoa. Dongwon Industries has announced a collaboration to build a small tuna processing plant in Kiribati in an aim to secure access for highly competitive fishing days and market access to the EU (if rules of origin are met). It has also engaged in ongoing negotiations to build processing plants in exchange for access in PNG and Solomon Islands, though there has been no recent progress on these proposals.

Bolton Foods is part of Bolton Group – a large privately-owned company offering a wide range of consumer goods under five business units. Bolton Foods focuses on premium branded shelf-stable tuna products and has developed high quality product specifications. It wholly owns three canned tuna brands, holds shares in several other important brands and distributes tuna product to over 60 countries. 

Since 1999, it has made several acquisitions to become more vertically integrateddiversified its portfolio of brands and processing operations geographically from Italy into other markets within and outside of Europe; and further secured access to raw material. Bolton’s purchase of the Saupiquet brand (1999) cemented its standing as the EU canned tuna market leader and integrated the firm into fishing with four large tuna purse seiners operating in the Atlantic and Indian Oceans. Supply from those vessels feeds non-branded processing plants in West Africa, Spain and Latin America that handle loins and finished goods production for Bolton. More recently, it purchased Calvo, acquiring Spain’s leading canned tuna brand and processing plants in Spain, El Salvador and Brazil, and a fleet of seven purse seine vessels. In 2013, it acquired a share in US global tuna trading company, Tri Marine, which strengthened its links to the WCPO and gave it access to supply, processing capacity, a niche brand in the US market and fishing vessels. Its 2015 it acquired Conservas Garavilla and its two brands, with presence in Spain, across the Americas and in North Africa, as well as processing plants in Spain, Ecuador and Morocco and four purse seine vessels. 

Bolton also has processing capacity in Italy which relies on imported frozen loins. To retain competitiveness for processing facilities in Europe, Bolton pioneered the import of pre-cooked loins, and has continued to innovate mechanized canning facilities that require minimal labour. Bolton also sources some branded finished goods from processors in Spain, Thailand, Ecuador, Ivory Coast and Mauritius. It is presently focussed on growing its presence in international markets, expanding into online and convenience sales platforms. It continues to differentiate its products through premium quality and ingredients as well by developing value-added products. It has launched its ‘Responsible Quality’ programme, through which it undertakes a range of corporate social responsibility initiatives related to environment, health and labour. Partnerships with advocacy organization World Wildlife Fund (WWF) focus on sustainability and traceability. 

Like other firms, Bolton is linked to the WCPO through its use of raw material from the region. It has direct links through its shareholding in Tri Marine, which owns a Solomon Islands’ flagged fleet of seven purse seiners and four pole and line vessels. Tri Marine is the majority shareholder of the Soltuna processing plant in the Solomon Islands, whose primary business is to process loins for Bolton. Tri Marine also owns six US-flagged purse seine vessels operating in the WCPO and Samoa Tuna Processors in American Samoa, which is presently not operating but leasing cold storage to Starkist. 

Princes Group focuses on the import, manufacture and distribution of food and drink products to the grocery trade. It is a private company headquartered in the UK and owned by Mitsubishi Corporation; being a part of one of the world’s largest trading companies means that Princes has access to financial resources that enable it to act on M&A opportunities. It holds a wide portfolio of over 350 Princes’ own brand products, including Princes canned tuna, and also provides private label canned tuna for EU supermarkets. Over 70% of all sales take place in the UK, where Princes holds around 25% share of the canned tuna market, chasing Thai Union’s 35% market share with its John West brand. To improve profitability, Princes has reduced can size, and developed value-added products. Princes has high exposure to a concentrated number of buyers and is actively seeking new markets.

Princes is vertically integrated from canned tuna brand ownership into processing, with a major factory complex in Mauritius, making it a competitor to Pacific Island processors because of its duty-free access to the EU market. It complements supply with contract processing arrangements with firms in Ecuador, Thailand and the Philippines. 

Princes is not planning any major changes and is remaining focussed on its existing core businesses. It is developing sales of value-added tuna products but remains constrained by price and promotional offers in the UK market in particular. Following poor performance on Greenpeace rankings, Princes committed to sourcing 100% of its supply from either pole and line fishing or purse seine fishing on free schools. Princes now sources MSC ‘wherever possible’ and is procuring fish from several MSC fisheries and several fisheries under Fishery Improvement Projects (FIP). Princes does not own boats, which makes it sensitive to raw material price fluctuations. It has no direct investments in the WCPO, but it is a leading partner with Pacifical and was the first UK brand to sell tuna from the MSC certified PNA fishery. 

Bumble Bee is a manufacturer and brander of seafood products with a focus on tuna, ready to eat meals and a range of other shelf-stable and frozen seafood and protein products in the US and Canada. It is owned by Lion Capital, a private equity firm focussed on the fast-moving consumer goods sector. In the US, the firm markets products under the Bumble Bee and Wild Selections brands and is the US leader in canned albacore, which has higher value than light meat product. It sells canned tuna, as well as a wide range of shelf-stable seafood and chicken products. In overall tuna product offerings, Bumble Bee is number two in the US market, accounting for 25% of the category in value sales. Connor Bros. is the Canadian marketing arm of Bumble Bee. It owns the Clover Leaf brand, Canada’s market leader in canned tuna, as well as Brunswick, Sweet Sue, and several other brands that sell tuna, other shelf-stable seafood and protein products. 

Bumble Bee is not backward integrated into vessel ownership. Rather, to secure supply it has developed a global sourcing and production strategy that focuses on white meat product. Bumble Bee sources white meat loins from Fiji (PAFCO – Bumble Bee managed plant) and Mauritius and light meat loins from Thailand and Ecuador (and very small amounts from SSTC in Papua New Guinea), for its Santa Fe Springs plant on the west coast of the US. In addition to processing for its own brand, the Santa Fe Springs plant co-packs for Chicken of the Sea; while Chicken of the Sea’s plant located on the east coast of the US co-packs for Bumble Bee. Bumble Bee also has a strong historical relationship with trading company FCF. Bumble Bee has pursued and been the object of several M&As in recent years. It has been pursued by private equity funds seeking to increase the value of the brand before selling it for a profit. Thai Union attempted to acquire Bumble Bee, an effort that terminated in 2015 as antitrust clearance procedures stalled and opened the door to unfolding price fixing revelationsamong the US ‘big three’ canned tuna brands. In the wake of the US price fixing scandal, Lion Capital is unlikely to sell Bumble Bee in the near term. 

Future developments focus on sustainability, traceability and product diversification, and on jump-starting the North American market after a prolonged decline. It has recently launched a catch-to-can, consumer-friendly tracking programme. In its effort to boost the stagnating US market, Bumble Bee has emphasised the health and quality attributes of its products, differentiated its products from lower quality competitors, and developed value-added product lines, including a move into the freezer aisle facilitated by its purchase of Anova Foods. 

Bumble Bee has several direct links to the WCPO. It manages the majority government-owned PAFCO plant in Levuka, Fiji, which supplies its mainland US plant with albacore loins. In recent years, it has offered PAFCO loans for cold storage and infrastructure upgrades, though high operating costs and supply concerns are ongoing. It has also purchased small volumes of loins from SSTC in PNG. Its 2013 purchase of Anova Foods deepened links to the Pacific as the firm sources from the Cook Islands and the Federated States of Micronesia, in addition to Indonesia. Anova has initiated sustainability initiatives in those locations. Bumble Bee has also announced a deal to bring Pacifical products to the US. Several exploratory initiatives, including for a loining plant in Samoa and for processing in Vanuatu, are yet to come to fruition. 

Implications for Pacific Island Countries 

Collectively, the five case study firms reveal a diversified set of strategies in the shelf-stable tuna sector. While all of the firms use M&As to expand the scope of their business portfolio, they do so in different ways and for different reasons. In some cases, this has deepened horizontal integration, expanding a firms’ traditional strength by, for example, purchasing processing plants in strategic locations, or acquiring brands that offer access to new markets. In others, they have enabled vertical integration outward from the processing node of the canned tuna value chain into direct marketing, branding, trading and/or fishing. Each firm has employed these strategies in distinct ways and to various extents. 

The cases studies offer evidence of growing consolidation among leading firms with core competencies in processing and branding, though the pace of consolidation is likely to slow with many large mergers now complete or blocked by anti-trust regulation. There is a high degree of vertical integration between processing and branding, with some, but not all firms, also backward integrating into trading and/ or vessel ownership to secure supply. The large investments that several firms are making into brands offers evidence of brand rent in shelf-stable markets. This has relevance for efforts from Pacific Island countries, like Pacifical, to develop links into branding to improve returns in the region. 

These features also relate to the degree in which each firm has exposure to raw material price, that is, the extent to which a firm’s profitability is influenced by fluctuations in canning-grade tuna price movements. Firms that are vertically integrated into fishing have lower exposure and may in fact benefit from raw material price increases. Processing-focussed firms with high exposure to raw material prices have adopted strategies such as investing in cold storage to hedge against such risks. 

Several of the firms reviewed are financialized – that is, intertwined with transactions in which profit making and risk hedging occurs through financial channels, rather than only through trade and commodity production. Access to financial capital enables these firms to make strategic investments, counter hostile take-overs, and weather unexpected costs that might hit competitors with access to fewer resources. 

In addition to these firm-specific dynamics, the analysis reveals several broader dynamics that are impactful industry-wide and have specific implications for Pacific Island countries. 

As a group, branded-processors are able to weather fluctuations in raw material price, with variation among them. This might be explained by a combination of factors including (a) cross-subsidisation (e.g. boat ownership and/ or other business segments); (b) greater focus on cost control and/ or synergies from M&As; and (c) investment in new process technologies and value-added product innovation. There has been relative stability in aggregate branded-processor profit. This may relate to these firms’ market power and related ability to squeeze non-branded suppliers (of which there are many, in sharp competition among one another), capture brand rents, and ad hoc strategies such as the recent US price fixing scandal and the prior role of the Pacific Operating Committee in stabilizing canning-grade albacore price. The firms appear to have factored in, and adapted to, the PNA Vessel Day Scheme, and related WCPO initiatives such as high seas closures and limitations on and charges for FAD fishing. 

Processing firms, as they form various degrees of forward and/or backward integration, continue to develop and rely on and create global procurement and production strategies to secure both raw material supply and market access. These strategies continue to be formulated around trade policy, labour productivity, and resource access. 

Product diversification and development of value-added products is finally becoming more established in many of the major and emerging markets. If value-added products take fuller hold and spur market growth and improvements in profitability, all of those involved in the global value chain – including Pacific Island country resource owners and processing firms – will compete to capture the value added. There is an opportunity to increase yellowfin volumes caught from the WCPO – and/or to direct existing yellowfin that presently gets mixed into ‘light meat’ products – to substitute volumes supplied from the Indian Ocean to high value EU market segments, given the IOTC yellowfin stock is overfished and subject to overfishing, while WCPO stocks remain healthy. 

One of the most significant recent developments in the canned tuna sector is the increasing focus on sustainability, eliminating IUU fish in supply chains, traceability and ethical labour practices. Many such efforts began as a result of external pressure from advocacy organisations and resulting demand from buyers. They have now been internalised within many firms, and/or are being developed through collaborations between firms and advocacy groups. Generally, these movements will present both costs (auditing, management and production changes) and opportunities (reputational gains, market access, potential price premiums) to fishing fleets, processors and branding and retail. It is not yet clear how these will shape raw material prices and related access fees. 

Pacifical stands to be an important supplier of certified product but will also face increasing competition from other MSC certified fisheries as major fishing and trading companies (Tri Marine, FCF, Dongwon) obtain their own certifications for purse seine fishing operations in the WCPO. These competing certifications will likely have a different pricing structure which is more palatable to brand owners (i.e. MSC premiums payable on the cost of raw material (i.e. $/tonne) rather than the Pacifical model where a premium is charged on finished goods (i.e. % of gross sales value)). Competing certifications will not have compulsory labelling requirements, which is a key feature of the Pacifical model. 

PICs needs to continue to conduct careful analysis of proposals from foreign companies expressing interest in investing in onshore processing developments. Companies considering making an onshore processing investment are usually doing so as a means to obtain beneficial access to fishing through guaranteed and/or discounted fishing licences. There are multiple cases of companies expressing interest in processing facilities in various Pacific Island countries which have not yet or are unlikely to come to fruition.
The Impracticability Exemption For Transhipment on the High Seas by Francisco Blaha

Not long I wrote about a paper quantifying transhipment at sea, and some the failures around their management, since while they regulated (and in cases prohibited) by RFMOs, the decision making (and reporting) stays with the flag state. In the WCPFC the key word is the “Impracticability” as an Exemption to the WCPFC’s Prohibition on Transhipment on the High Seas. And to dig deeper on this issue a paper was tabled by the RMI delegation to the present TCC here in Majuro.

yet it mostly only two

yet it mostly only two

I don't personally know the author Chris Wold from Lewis & Clark Law School, but I know well and respect a lot two colleagues that contributes to the study: Vivian Fernandes and Wez Norris, as well as Bubba Cook from WWF that commission it, and the product is excellent. I only have some small “operational side” criticism to it, which I comment at the end of the blog.

In any case, paper is luminating and put very good facts on issues we kind of know but can be accounted know. Basically the paper show that most of the issues we have are with a handful of Distant Water Fishing Nations, and show that the usual reason to justify the “Impracticability” of not transhipping at sea don't really hold any ground.

I totally recommend you download the paper as it is public and read it. I just will quote some of the key aspects in personal opinion.

The WCPF Convention and the WCPFC have also sought to limit transhipment at sea, but they have established different transhipment rules for purse seine vessels and other fishing vessels. The WCPF Convention expressly prohibits transhipment at sea (on the high seas and in a WCPFC Member’s territorial sea and exclusive economic zone) by purse seine vessels operating within the WCPFC Convention Area.16 For longliners and other vessels, however, the WCPF Convention only requires WCPFC members and cooperating non-parties (collectively known as CCMs) to “encourage their vessels, to the extent practicable, to conduct transshipment in port. ”Through a binding conservation and management measure (CMM)—CMM 2009–06—the WCPFC prohibits longliners and other vessels from transhipping on the high seas except where CCM has determined that “it is impracticable for certain vessels . . . to operate without being able to tranship on the high seas.” 

CMM 2009–06 requires WCPFC Members to make vessel-specific determinations as to impracticability and submit a plan detailing the steps being taken to encourage transhipment in port. However, certain CCMs are not implementing either of these duties and transhipment on the high seas has become the norm rather than the exception.More than 50% of longline and other non-purse vessels are registered to tranship on the high seas and significant amounts of valuable tuna, including 36.9% of bigeye tuna, are transhipped on the highs seas. Clearly, CMM 2009–06 is not effectively reducing transhipment on the high seas.

Moreover, the evidence indicates that transhipment in port is not impracticable. Port infrastructure throughout the region is sufficient to support and supply fishing vessels.The purse seine fleet, which catches a significant amount of fish on the high seas,still manages to transship in port. At least three longline fleets—those of the EU, Japan, and the United States—fish on the high seas hundreds of nautical miles from port yet tranship all (EU and U.S.) or most (Japan) of their high seas catch in port.

A large number of high seas transhipments occur just outside the exclusive economic zones (EEZs) of CCMs, suggesting that these vessels are able to travel a much shorter distance than the EU, U.S. and Japanese longliners do to transship in port and that they are moving from waters under national jurisdiction to the high seas in order to avoid monitoring by coastal State CCMs.

In fact, over the last two years, just three CCMs—China, Chinese Taipei, and Vanuatu—accounted for 84% and 89% of those transhipments in 2015 and 2016, respectively. Moreover, costs associated with transhipment in port are insignificant in relation to the costs of operating a tuna vessel. Fuel and labor costs do not fully explain an impracticability of transhipping in port as overcapacity may play a more significant role as evidenced by the profitability of the Japanese fleet.

Given the variables affecting profitability— operational costs, subsidies, over-capitalization—assessing whether transhipment in port causes “significant economic hardship” on a vessel-by-vessel basis is challenging. Even two factors that have been proposed recently for exemptions from a high seas transhipment ban—the lack of ultralow temperature (ULT) freezer capacity at some ports and the need to get fresh fish to market— are questionable.

Thus, this paper proposes replacement of the “impracticability” test with bright line rules. It begins with a presumption against transhipment on the high seas but allows, at least in the short term, exemptions to tranship ULT frozen fish from a fishing vessel to a carrier vessel with ULT freezer capacity and for fresh fish. However, it directs the WCPFC Secretariat to study whether ports have a shortage of ULT freezer capacity and whether carrier vessels can be placed in various ports to accept ULT frozen fish just as they would on the high seas. It also directs the Secretariat to identify the circumstances under which fresh fish needs to be transhipped in order to maintain a high-quality fish product.

In addition, and in sharp contrast to the current regime, the exemptions must be approved by the WCPFC; they cannot be unilaterally established. The abject failure of CCMs to comply with the WCPFC’s information requirements, including the submission of a plan to encourage transhipment in port, indicates that unilateral decision-making should be abandoned.

Moreover, to promote the implementation of a plan to encourage transhipment in port, exemptions may not be granted for more than three years. While a CCM may apply for a new exemption for a vessel at the end of the three years, presumably the WCPFC will want evidence that the CCM is implementing its plan before granting the exemption. 

Transhipment in Practice

Transhipment practice within the WCPFC varies by region and by CCM. Some CCMs, for example, prohibit transhipment at sea by all vessels in all circumstances, including the Parties to the Nauru Agreement (PNA).

Other CCMs, however, are availing themselves of the exemption for transhipping at sea at a rate that indicates they are not making vessel-specific impracticability determinations. In 2016, for example, CCMs authorized 2,223 of 4,468 (49.75%) WCPFC-registered vessels to tranship on the high seas, including 58.2% of all longline vessels, 88.2% of all pole-and-line vessels, and 42.8% of carrier and bunker vessels. The percentage of vessels authorized to tranship on the high seas rose to 52% (2,431 out of 4,658 vessels) in 2017, with the majority of these vessels being longline vessels (1,831 vessels).

The number of reported high seas transhipment events has fluctuated from year to year between 2011 to 2016, with a high of 948 in 2016 and a low of 525 in 2012.The number of high seas transhipments, however, appears to be trending upwards. See Table 1 above. One possible reason is the move of some fleets from fishing in EEZs to the high seas due to increasing costs of fishing in the EEZs of some Pacific Island States.

All reported high seas transhipments in 2015 and 2016 were conducted by fishing vessels registered to just 5 CCMs—China, Korea, Chinese Taipei, Vanuatu, and Japan—but the vessels of China, Chinese Taipei, and Vanuatu accounted for 84% and 89% of those transhipments in 2015 and 2016, respectively. See Table 2 above. As 22 of the 24 registered longline vessels flagged by Vanuatu are owned by individuals or companies in China and Chinese Taipei,it may be possible to attribute an even greater portion of high seas transhipments to those two CCMs.

High seas transhipments in 2016 accounted for a large percentage of the catches for certain species, including 25.3% of albacore, 36.9% of bigeye tuna, and 10% of yellowfin tuna. The proportion of high seas catch relative to catch limits appears to be even greater when the small number of vessels transhipping on the high seas is considered: just 352 fishing vessels of the more than 3,100 non-purse seine fishing vessels registered to fish in the WCPFC Convention Area accounted for the catch transhipped on the high seas in 2016.

Yet, according to the annual reports of CCMs, some longline fleets rarely, if ever, transship on the high seas. For example, 23 CCMs reported that vessels they flag fish on the high seas, but just 7 of these CCMs (including carrier vessels from Liberia and Panama) reported that vessels they flag tranship on the high seas. The 157 U.S. and 446 Japanese longline vessels rarely tranship on the high seas. In fact, no U.S. vessels transhipped on the high seas in 2014, 2015, and 2016; Japanese vessels reported just 31, 29, and 28 high seas transhipments in those years.

Significantly, these vessels typically fish far from the ports in which they land their fish. U.S. tuna longline vessels fish up to 1,000 nautical miles from Honolulu, although most trips are within 500 nautical miles, yet land their catch in Honolulu.Japanese longline vessels focus their fishing in tropical waters easily more than 1,000 nautical miles from Japan,yet land their catch back in Japan.

Conclusion

This paper proposes replacement of the “impracticability” test with a presumption against transhipment on the high seas. It allows, however, time-limited exemptions to ensure transhipment of ULT frozen fish from a fishing vessel to a carrier vessel and for fresh fish.

However, it directs the Secretariat to study the circumstances under which these exemptions are needed; the exemptions expire unless these studies conclude that the exemptions are necessary. In addition, and in sharp contrast to the current regime, the exemptions must be approved by the WCPFC; they cannot be unilaterally established.

The process that applies to exemptions for purse seine vessels would be applied to all other vessels. Moreover, to allow the WCPFC to review implementation of such plans to encourage transhipment in port, exemptions may not be granted for more than three years, although CCMs may apply for a new exemption at the end of the three years. Only through such a process can the WCPFC help minimize IUU fishing, prevent human rights abuses, and reduce opportunities for human trafficking and smuggling of guns, drugs, and wildlife. At the same time, it will help Pacific Island States develop their ports and economies.

—-

If I was to criticize something is only from the operational side. I don't think enough differentiations and alignment was made in between transshipping defined as “vessel to vessel” and “landing and containerization”, this latest practice while sometimes referred as transshipment, but is not. Furthermore, as soon as the fish leaves the boat and is landed (even if in a custom bonded wharf) all sorts of market access and trade implications arise.

Furthermore the excuse that ports don't have ULT (Ultra Low Temp -50C for sashimi) capacity should affect transshipment, since if the fish is being “transhipped”, then by definition is not being landed, so what does the port as to do with it… if anything (from my experience) if you want to transship ULT fish in between vessels, is much easier (and more importantly safer) to do it in the protected water of a port, rather in the high seas where you are way more exposed to weather events and rain (at -50C fresh water drops causes marks on the fish skin affecting value). 


The WCPFC Technical and Compliance Committee here in Majuro by Francisco Blaha

I’m back in Majuro under my work as aOffshore Fisheries Advisor with MIMRA. Normally it is busy time but is just only us…. Yet this time is really busy! Besides having 12 Purse Seiners in the Lagoon (+ 3 arriving over the next few days), and 7 carriers; RMI is hosting the Technical and Compliance Committee (TCC) of the WCPFC… and everyone and his dog is here. Majuro is booked out!

L1060741.jpg

The Western and Central Pacific Fisheries Commission (WCPFC) supports three subsidiary bodies; the Scientific Committee, Technical and Compliance Committee, and the Northern Committee, that each meet once during each year. The meetings of the subsidiary bodies are followed by a full session of the Commission that is in December (this year in Honolulu)

I’ve never been in a commission meeting, since it is normally only for either staff from the members countries, people form the commission, regional organizations and approved observers (mostly NGOs) and while I have worked for pretty much everyone one of those, as an independent consultant (and mostly operationally) I don’t fit in the picture, yet I know a lot of people that are the picture!

Thankfully MIMRA’s boss Mr Glen Joseph  has been a total champion with me, he really support my ideas and ways> I’m totally honoured that he invited me to be part of the RMI delegation, so I will join them for some areas of interest (FADs, PSM and compliance scheme), while we keep working with all the rest of the normal jobs that need to happen for us! Yet for TCC I’m more than happy to helping with: fixing the boarding boat, reading with some policy briefs and picking up people for the airport!

Hence yes, I’m quite exited, even if I was told by everyone that I will find it really slow and frustrating, but that is part of the deal, and something I need to learn about.

Many people says that RFMO are too confidential… yet all the documentation for TCC is available on line, as well as for the 3rd meeting of the WCPFC FAD Management Options IWG, that is the other meeting I will be involved.

So yes, this are my next couple of weeks! If you are one of those that read this and we never meet before come and say hello! I know my way around the place and have the right places and times for a surf, a swim, a yoga session, some healthy food, good sashimi, and even some pizzas with my host family!

Working in Kiritimati Island by Francisco Blaha

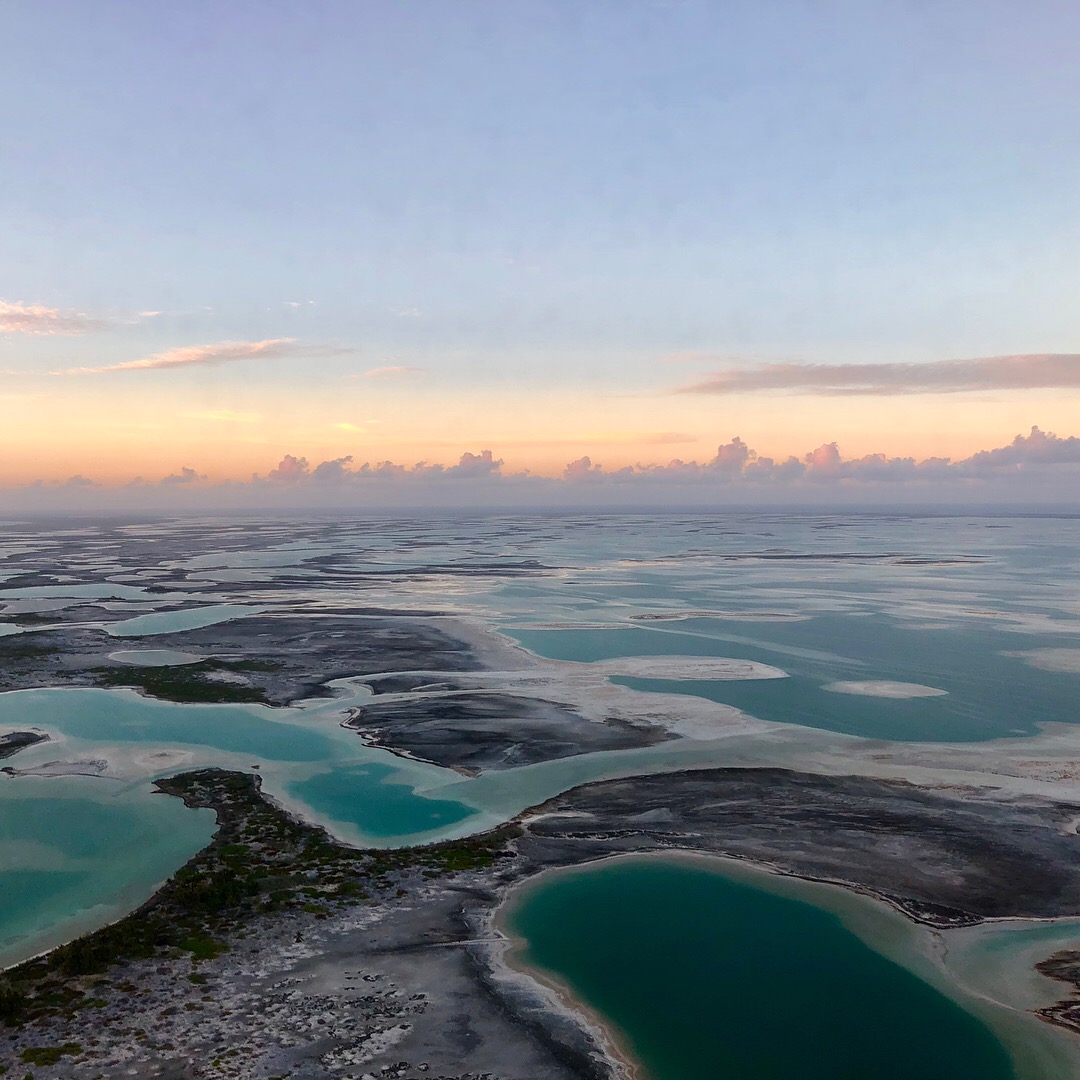
I’m a very lucky man in many aspects, and one of them is that I have the opportunity of working in really unique places… and in terms of uniqueness is hard to beat Kiritimati island.

it was just so good to go back to catch fish with real straight people.

it was just so good to go back to catch fish with real straight people.

I have spent my last week there working under the Towan Waara programme which is a NZ MFAT supported program working the Kiribati’s MFMRD. The programme is aimed to support the good work of MFMRD in various aspects of their responsibilities. My bit has to do with some of the issues that are part of EU market access requirements no only form the IUU CCS side, but also from the sanitary (SPS) side, and area I did a lot of work in the past.

The reason why I had to spend only a week, is because there is 1 flight a week only, so is either 1 or 2 or 3…. If is up to me only, I will spend more than just one. But I had to get to my work in Majuro,where I’m also doing work for NZMFAT.

Kiritimati is on the Line Islands, one of the 3 groups of Kiribati, each of them separated by highs seas patches. The place has an amazing history rich in a bizarre amount of details from early oceanic (allegedly Polynesians) settlement, to be potentially be claimable by Spain! (sic) to have been “owned” by a millionaire French priest that had a huge coconut plantations there, printed his own stamps and named villages as Paris, London, Poland, to British annexation and “sharing” with the US, so both decided to denotate Nuclear weapons in the atmosphere without mobilising the local population, nor the Fijian and NZ troops working there… read and explore the place amazing story from their Wikipedia page and others.

The place is as well a sport fisherman’s destination as the come there from all the world (literally) to do fly-fishing for bonefish (mostly catch and release) in the flats as well as GT in the lagoons. This as sprung a mall industry and most of the accommodation available is based around catering to them.  

Normally I have no issues staying anywhere, I’m really easy going (if it has some electricity for my coffee is good and if it near the ocean is excellent). The most upmarket places cater for the richer people there, but I’m always weary of staying with drunk (most of them drink!) recreational fishers that as soon as they know I work in commercial fisheries management and controls (and even worst that I was a commercial fisherman) start going on and on how I suck at my work and how to do my job better.  Somehow a rich dentist Salt Lake City or a businessman of Brisbane don't see any issues in telling me how to do my job better, but he would be horrified if I start advising him how to do their job.  

Surely in the fisheries world we all have a place and this group definitively help a community that otherwise has not much potential income earners… but the moral superiority is something I resent… I assume that having the money to come all the way there, catching fish and stressing them into a fight for some sort of perhaps sadistic pleasure and a ego picture to then let them go (with arguable limited survival rates), as immediately start again with another one, is definitively not my game… but then that is me… I catch fish to eat it, and I used to catch it as a job, is not enetrtainments or “sport”

Anyway stayed at a low key place called Sunset Horizon... I'm the only guest which suits me fine... only the last day a group of surfers from Fanning island come over and I got even more excited about coming back with my board!

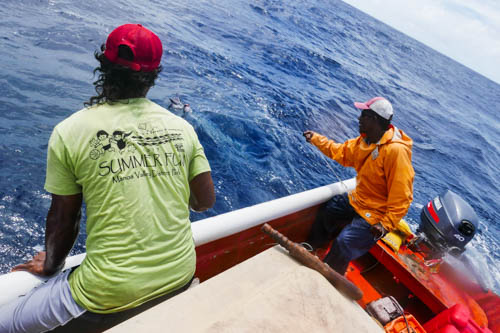
In any case, it has been a while since I spent 16 hrs at sea working with 3 cool guys on fishing, gutting and icing fish in a banana boat (which was great!), but never the day after training fisheries officers on Information Management Systems, PSM and vessels intelligence analysis and even less under the same mission for the same program!

So!! Thanks for the trust NZ MFAT / Towan Waara I don’t think many donors (and managers) will trust a consultant with 2 areas of work, pretty much at both ends of the fishing spectrum.

On the PSM and transhipment side of my work, it was along the line of what I did in Tuvalu and other countries, but with a further twist, Kiritimati is unique transhipment port as it serves not only the WCPFC vessels transhipping to carriers with final destination in Bangkok and Vietnam, but also a number of IATTC (to which Kiribati is full member) vessels, with carriers destined to Manta in Ecuador. No other port in the WCPO is in that position.

IATTC only requires prior information from vessels that intend to participate in transhipments at port. Although the IATTC Resolution and data availability omits some important elements present in the system for WCPFC and PSM best practices. Such as port and date of last port call, type of vessel and VMS information

The IATTC still does not have a port inspection scheme, despite six years of discussions on proposals drafted to adapt to the needs of member States, hence their requirements are less “defined” than those for WCPFC, and there is no regional body that provided the type of compliance evaluation tools that FFA provides, yet the requirements used by Kiribati as a Port State are t be consistent across the board, yet based on available information

Hence the standardization of all these elements are areas we are working with.

On the other side, I went back to my industry days and to my beginnings into the consulting world.  So I worked on a plan to support potential exports of the local processing facility that sources from the locally based small scale fleet, so I worked the value chain from catching (out at 4 am) to the processing of the fish for local market, accessing the regulatory and operational need for potential airfreight exports to the US and Australia/NZ/Asian markets

I loved every minute of it! I wish all missions were as diverse as this one and in places so amazing as Kiritimati… I totally recommended to visit it if you ever have the chance.

Some images of the place, and even better is my birthday today!

Explaining my non fishy friends about High Seas Fisheries and RFMOs by Francisco Blaha

L1060995.jpg

Lots going in the media in regards the negotiations for a treaty on high seas biodiversity beginning this week at the UN in New York, (under Resolution 72/249) for a new international legally binding instrument (ILBI or treaty) under the UNCLOS for the conservation and sustainable development of marine biological diversity in areas beyond national jurisdiction (ABNJ) also know as High Seas. This is a series of four two-week meetings between now and early 2020. The final treaty will be the third “implementing agreement” under UNCLOS.

I was trying to explain to my non-fisheries friends (and my kids) the issues around fishing in the High Seas, so I decided to dive a bit deeper and understand the whole picture for my self, since I have 6 hrs in an airport on my way to a job in Kiritimati, and here is the result.

Disclaimer: I’m not a legal or institutional fisheries expert, all the opposite! Im the 1st to admit I’m just a fisherman with a laptop, and jsu based my self on lots or reading and some references that are at the end of the post. So if you (reader) find mistakes please let me know.

UNCLOS (1982 UN Convention on the Law Of the Sea)
UNCLOS  defines and establishes the rights and responsibilities of countries related to their use of ocean resources—including environmental impact, management of fisheries, and business practices. Three legal tiers govern the ocean—a territorial approach, a flag state approach, and a port authority approach. (I wrote enough about PSM in the past)

The territorial approach establishes zones that delineate the extent of sovereignty and each country’s jurisdiction over ocean resources. These zones allow countries to exploit, manage, and protect their marine resources. The three essential tiers of ocean zones are: territorial water, contiguous zone, and EEZs.

  • Territorial waters extend out 12 nautical miles and countries have full sovereignty over this area, wherein all national laws and regulations apply.

  • The contiguous zone starts where the territorial zone ends and continues 12 nautical miles further. Countries have the power to enforce certain domestic laws pertaining to customs, taxation, immigration, and pollution.

  • Beyond the territorial waters, and including the contiguous zone, is the EEZ, which extends outward 200 nautical miles. An EEZ assigns control of the economic resources to the coastal country, including rights to fishing, mining, and oil exploration (these last 2 can go to 350 miles)

In response to the limits of the territorial approach, the international community established requirements for vessels to be marked with the flag of its home country. Under these requirements, each flagged vessel is subject to the laws of the country where it is registered, even outside national territory. Moreover, the flag state is responsible for enforcing regulations over such vessels, including both international and national maritime laws.

maritime zones.jpg

In addition to being under the jurisdiction of a flag state, being flagged also provides the vessel with protection from other states. If a stateless vessel is encountered by the authorities of a state, it risks being seized by that state, and the adjudication process varies country to country.

Beyond those waters, the international community has established a governing system of regional fishing bodies, which includes a subset of RFMOs mandated to “adopt conservation and management measures for fishing on the high sea.”

RFMOS (Regional fisheries management organisations)
Amongst UNCLOS requirements are the duty to conserve the living marine resources of the high seas and to cooperate with relevant coastal states and other high seas fishing states in the conservation and management of stocks of fish that occur both within areas of national jurisdiction and on the high seas – primarily straddling and highly migratory fish stocks.

Moreover, UNCLOS contains obligations to protect and preserve the marine environment and requires that flag States exercise effective control over their vessels operating in high seas areas. UNFSA elaborated on the general provisions of UNCLOS and established RFMOs as the institutions charged with managing high seas fisheries. 

RFMOs are assumed to provide a forum through which States will cooperate to achieve and enforce conservation objectives, both on the high seas and in areas under national jurisdiction. Their responsibilities include assessing the status of fish stocks of commercial value within their area of jurisdiction; setting limits on catch quantities and the number of vessels allowed to fish; regulating indirectly via CMMs (Conservations and Management Measures) that apply the types of gear that can be used, to species of interest, to reporting requirements, to interaction with birds, and thousand more issues… this CMMs then need to be incorporated into regulation by the member countries, and implemented by the flag states and slowly now more by coastal and port state when the offences are under their jurisdiction.

RFMOs vary widely in their effectiveness and many suffer from  shortcomings in their governance and management structures, and while criticised sometimes as toothless tigers, that is a bit unfair, since they are member-driven organisations. So if fingers are to be pointed... is to the members and not the just the body.

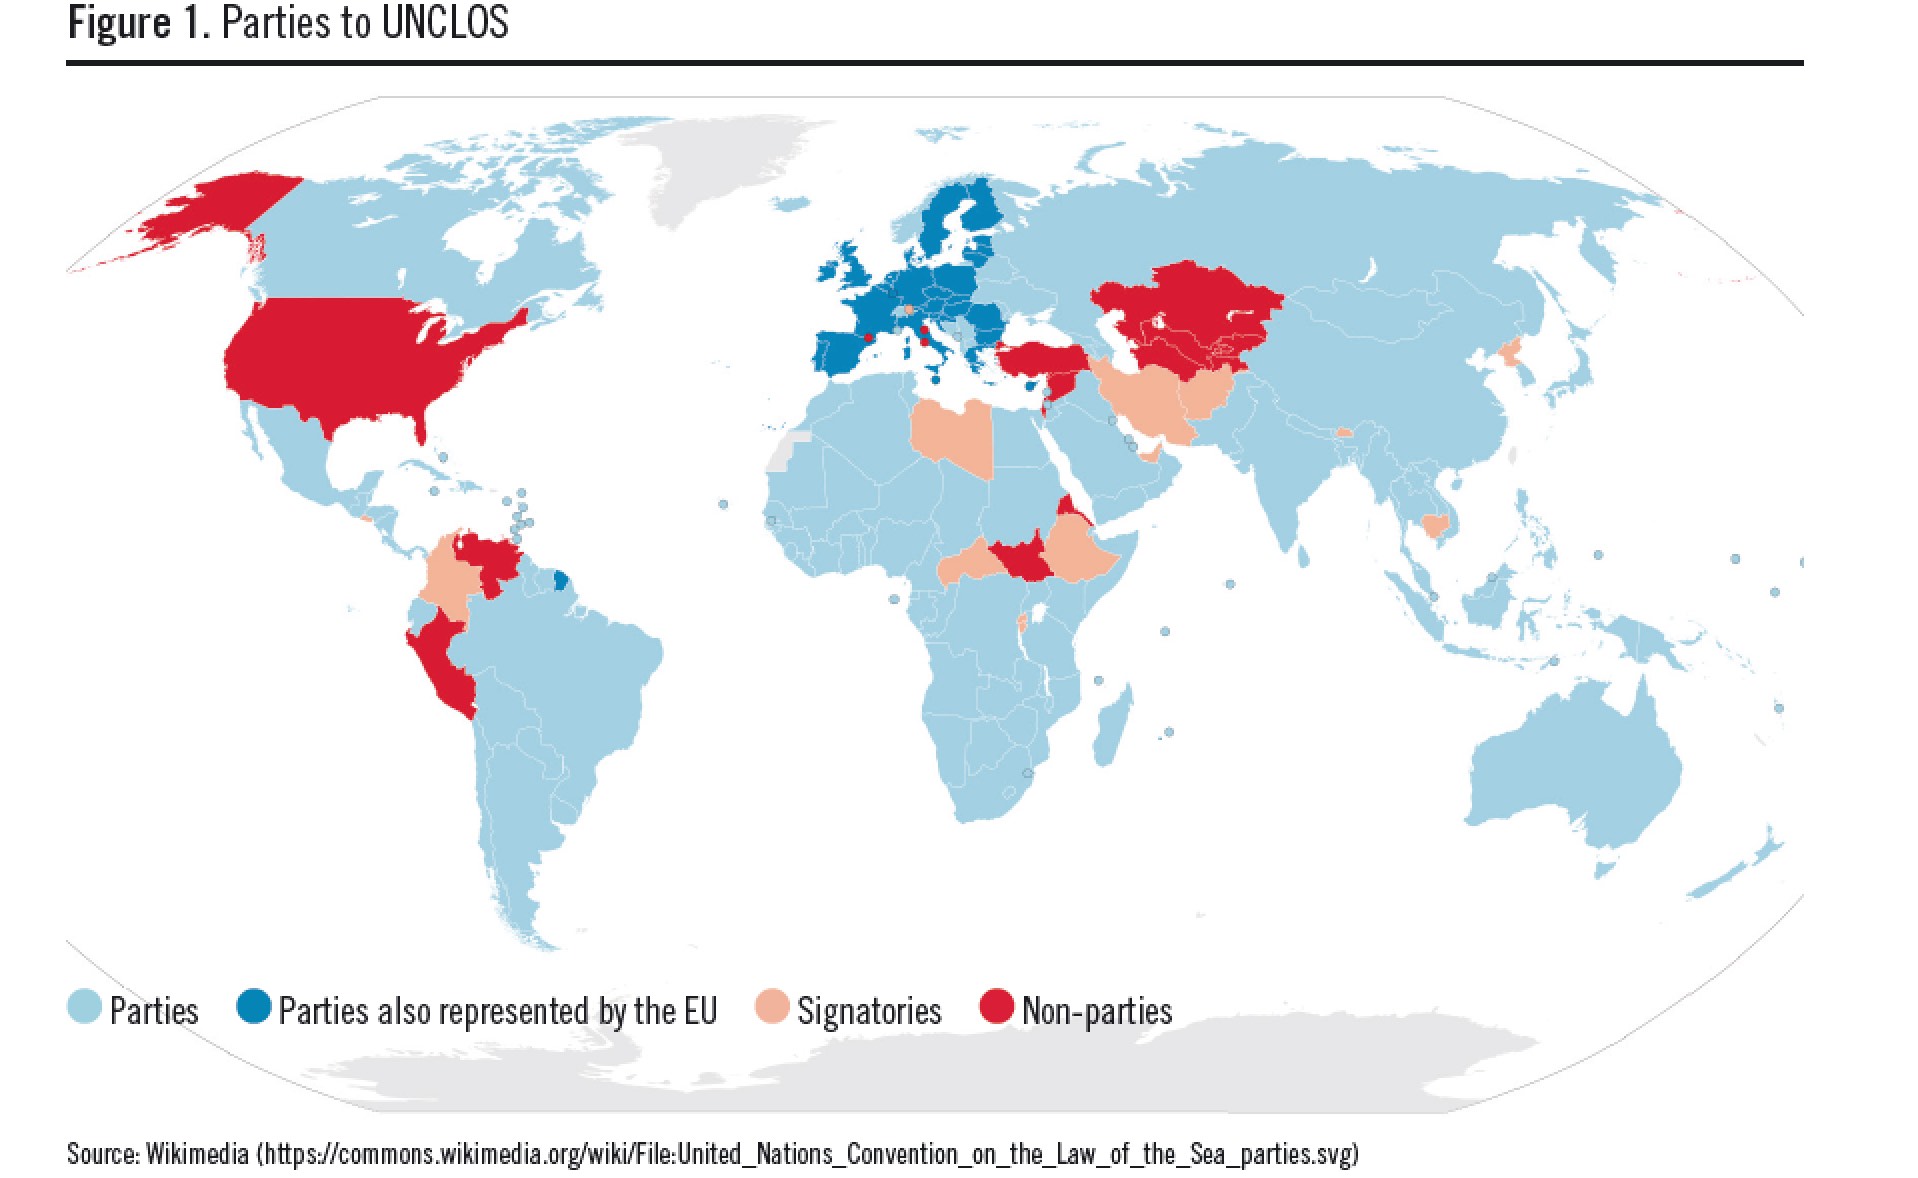
The regulations adopted by RFMOs only bind those nations that are Parties to the RFMO. Non-parties are free to do as they please, often with minimal repercussions; their catch, if in contravention of the RFMO regulations, would be considered unregulated. While the offending non-Party vessels and countries are often subject to port- and market-access restrictions, fishing on the high seas in the waters managed by an RFMO is not a crime.

Effective RFMO decision-making is often undermined by one or a handful of Parties. Many RFMOs operate on consensus-based decision-making, whether as a formal requirement or as standard practice; thus a conflict of interest, or a lack of political commitment by just one member, can prevent the adoption of meaningful regulations. 

Where RFMOs do not require consensus but can adopt regulations on the basis of a vote by a majority or qualified majority of the members, most also allow members to ‘opt out’ of regulations they don’t wish to accept or be bound by. 

Moreover, many RFMOs lack transparency in important respects, key decisions are often made in closed sessions – without the need for Parties to justify positions or with little accountability to the civil societies back home. 

Most RFMO member States have a direct economic interest in the fisheries managed by that organisation. They are often reluctant to accept new members and allocate them catch allocations. And many of these catch allocations are decided as result of stock assessments, which are in substantial part informed by flag state reporting, which many don't really do or do intentionally wrong, so it becomes a bit a vicious circle.

Also RFMOs tend to focus their management on a single species or handful of species of commercial value, which leaves the impact of fishing on many non-commercial species and the ecosystem effectively unregulated. However, despite being mandated to establish measures with respect to non-target species, associated and dependent species, and species belonging to the same ecosystem on the basis of the precautionary approach and ecosystem approach, RFMOs tend to fail short in consider impacts on the broader ecosystems affected by the fisheries they regulate.

Communication and coordination between adjacent RFMOs are complex, even if many DWFN are members of many, they sometimes have divergent policies for each one. Furthermore, each RFMO operates independently, with its own staff and funding. And there is a great disparity in funding levels and corresponding capacity among them. Roughly US$ 30 million is spent annually on fisheries management in the main 11 RFMOs, with most of it directed to the five main tuna RFMOs. These funding figures have dramatic contrast when compared to the approximately US$ 35 billion spent annually on global fishing subsidies, and even more so considering the consumer end value of the tuna industry (around 8 billion USD) or the estimates of value of IUU fishing (i.e. over 600 million USD in the the area of the WCPFC alone)

Beyond managing shared stocks, RFMOs could benefit from greater communication, to ensure they share lessons and avoid repeating mistakes; some RFMOs are much younger than others and can benefit from their greater experience. There have been important improvements in recent years, for example, the Contracting Parties to the five main tuna RFMOs have established the Kobe process in order to share information on issues of mutual concern and facilitate better coordination amongst themselves. 

In addition, a number of RFMOs (e.g. NAFO and NEAFC; SEAFO and CCAMLR) share information on IUU fishing and IUU vessel blacklists, while the Secretariats of the major RFMOs have held meetings in conjunction with the biennial meetings of the FAO Committee on Fisheries since 1999. 

Is also fair to say that the issues with a lack of coordination extend beyond fisheries. Other regional or global structures often exist in the same ocean space as RFMOs but manage other sectors. For example, UNEP’s Regional Seas Programmes address topics such as marine health and pollution; the International Maritime Organization (IMO) addresses shipping and potential discharges; and the International Seabed Authority (ISA) covers seabed mining. The actions and management decisions of these various groups may affect the marine environment and its fish stocks but coordination across the sectors is largely absent. 

 UN Fish Stock Agreement (UNFSA) 
Arguably the most important of the international fisheries agreements the UNFSA, establishes a range of obligations related to the conservation and management of fisheries on the high seas, which build on the more general provisions of UNCLOS18. Articles 5 and 6 of the UNFSA oblige States to: 

  • assess the impacts of fishing on target stocks and species associated with or dependent upon the target stocks, and prevent overfishing 

  • minimise bycatch, waste and discards, and impacts on non-target species 

  • protect biodiversity in the marine environment 

  • collect and share accurate and timely data on catch and bycatch and areas fished 

  • apply the precautionary approach, particularly where scientific information is poor 

  • protect habitats of special concern. 

The UNFSA obliges States to ensure the compatibility of measures for the management of straddling and highly migratory fish stocks adopted by coastal States within EEZs and RFMOs on the high seas. With regard to the duties of flag States fishing on the high seas, the UNFSA establishes a series of obligations in relation to compliance and enforcement (Articles 18–22). 

Amongst these is a requirement that the flag State exercises effective enforcement capabilities over fishing vessels flying its flag, so as to ensure compliance with applicable regional conservation and management measures irrespective of where violations occur. 

The flag State is also required to investigate immediately and fully any alleged violation of sub-regional or regional conservation and management measures and to report promptly on the progress and outcome of the investigation to the State alleging the violation and the relevant sub-regional or regional organisation or arrangement. In addition, the flag State must require any vessel flying its flag to give information to the investigating authority and, where sufficient evidence is available in respect of an alleged violation, refer the case to its authorities with a view to instituting proceedings without delay. 

UNFSA Article 21 establishes a list of ‘serious’ violations requiring enforcement action by the flag State and obligates the flag State to, where appropriate, detain the vessel concerned and ensure that, where it has been established that a vessel has been involved in the commission of a serious violation, the vessel does not engage in fishing operations on the high seas until such time as all outstanding sanctions imposed by the flag State in respect of the violation have been complied with. 

In language similar to UNCLOS Article 217.8, UNFSA Article 19.2 requires the flag State to impose sanctions that are “adequate in severity to be effective in securing compliance and to discourage violations wherever they occur and shall deprive offenders of the benefits accruing from their illegal activities”. There have been numerous cases where vessels identified by an RFMO as having engaged in IUU fishing have reflagged and continued fishing without effective action taken by the flag State concerned to penalise and prevent the vessel from continuing as an IUU fisher on the high seas. 

The UNFSA has been ratified by 83 states and the European Union, which includes most high seas fishing nations; however, important exceptions remain, e.g. China, Chile and Mexico. While several provisions of the UNFSA, primarily the compatibility and high seas boarding and inspection provisions, have been cited by a number of States as a reason for not having ratified the UNFSA, the conservation provisions of the UNFSA (Articles 5 and 6) are not in dispute. 

The relatively low number of ratifications is particularly striking when compared to the 168 ratifications which UNCLOS has (which includes 146 UN Member States, the EU, Cook Islands, Niue and Palestine). An additional three UN member states have signed, but not ratified the agreement)  Many nations have not ratified the UNFSA because they do not want to be bound by its more prescriptive requirements for fisheries management.

Unclos parties.jpg

The development of the Agreement was in recognition of the fact that the regime established by UNCLOS was inadequate to deal with the continued depletion of the world’s fish stocks, particularly straddling and high seas stocks. Importantly, however, the UNFSA does not seek to impose any additional requirements on Parties to UNCLOS, in fact it is first and foremost an agreement for the purpose of implementing the provisions of UNCLOS. While individual countries may consider it deficient, it cannot reach its full potential unless the most important coastal, fishing and flag States are parties to it, and implement it effectively. 

FAO Code of Conduct
The 1995 FAO Code of Conduct for Responsible Fisheries is one of the most important soft law instruments. Its purpose is to set international standards and norms for the development, management and utilisation of fisheries and aquaculture resources, in areas beyond and within national jurisdiction. As such it has been described as a “global ethic for the conduct of fisheries”. 

The Code has 10 objectives through which it promotes responsible fisheries by establishing scientifically based management decisions, which take into account all relevant biological, technological, economic, social, environmental and commercial aspects; establishes responsibilities for flag and port States; and recognises the importance of fisheries to food security, nutrition, and ecosystem health. There is a particular emphasis on conservation of living aquatic resources and their environments. It intended to serve as guidance for the development of national legislation. The conservation and management provisions of the UNFSA (Articles 5 and 6) and the FAO Code of Conduct (Articles 6 and 7)are very similar and in many cases contain identical wording. 

The FAO Compliance Agreement forms an integral part of the Code and is referenced in Article 1. The Compliance Agreement elements remain binding but overall the Code is a voluntary agreement. It relies on the goodwill of Parties to enact and abide by its recommendations. Unfortunately, it seems that this does not happen across the board. 

The FAO Code of Conduct reinforces the universality of the conservation provisions in the UNFSA and thus, together with the UNFSA provisions, should serve as the ‘international minimum standard’ for the management of fisheries on the high seas and be fully reflected in the basic convention texts and regulations adopted by RFMOs to manage fisheries on the high seas. 

FAO Compliance Agreement
The purpose of the 1993 FAO Agreement to Promote Compliance with International Conservation and Management Measures by Fishing Vessels on the High Seas (Compliance Agreement) is to provide an instrument for countries to take effective action, consistent with international law, to ensure compliance with applicable international conservation and management measures for living marine resources of the high seas. Adopted in 1993 and entering into force in 2003, the Compliance Agreement has been ratified by 48 nations plus the EU.

This instrument was negotiated to address the circumvention of international fisheries regulations by ‘re-flagging’ vessels to the flags of States that are unable or unwilling to enforce such conservation and management measures. The main obligation is for a Party to exercise responsibility over vessels flying its flag, and to provide information to a global record of fishing vessels (which became known as the High Seas Vessels Authorization Record – HSVAR). 

But what about capacity development?

Not all nations possess the same capacity to enforce the international or regional rules and regulations they have adopted. In an FAO survey in the mid-2000s more than one-half of the 64 self-reporting countries said their ability to control the activities of their flagged vessels on the high seas was ineffective or inefficient. 

Developing countries face a huge number of often competing pressures that limit their ability to make progress in fisheries management. Fisheries management requires a robust legal system, political will to develop binding management arrangements, and a justice system capable of successfully prosecuting offenders. There are numerous studies that show a high degree of correlation between weak governance and IUU fishing. 

Despite the millions of dollars that have been provided in direct aid to the fisheries sectors in developing countries and the capacity development funds established under specific treaties, there have not been substantial improvements in the high seas fisheries management. Neither has this funding, by and large, enabled developing countries to take a meaningful place in international management arrangements and a share of high seas resources. 

The 1993 FAO Compliance Agreement was the first international fisheries instrument to address capacity building directly. However, the 1995 UN Fish Stocks Agreement devoted an entire section to capacity development, including the establishment of an assistance fund to address the requirements of developing countries. Known as the Part VII Assistance Fund, it has operated successfully since its inception in 2005. Between 2005 and 2010 the fund amounted to just under US$ 1 million. The assistance fund has facilitated increased participation by developing countries in regional and international meetings and also enabled technical work and capacity development that might have not been undertaken if such activities had been dependent on funding from other sources. 

The FAO has channelled a significant amount of resources to support the implementation of the 1995 FAO Code of Conduct across the world. Funding has come from the FAO Regular Programme and non-FAO resources and was managed by a dedicated programme within the FAO Fisheries and Aquaculture Department. In 2000 the programme was replaced by the more elaborate, better-funded and more flexible FishCode Programme. A significant amount of FishCode Programme funding has been devoted to helping countries implement programmes to combat IUU fishing, including capacity development for the implementation of port State measures. 

Other international agreements also have provisions for capacity development (e.g. PSMA and the International Plan of Action to Prevent, Deter and Eliminate IUU fishing [IPOA-IUU]), as do individual RFMOs and individual States. 

The fundamental principles and legal obligations (e.g. the precautionary approach, ecosystem approach, etc.) that could lead to sustainable fisheries management, are already contained in many of the binding and non-binding fisheries agreements, and in the UNFSA in particular. What is needed is an effective and uniform application of these principles and obligations in practice. 

And hopefully, this new negotiation can help there… but that is a big if… 

Personally, after explaining it to my kids, I take away their suggestion: if it is that the high seas don't belong to anyone, but they belong to everyone, in that case, if anyone wants to fish there, it should have everyone’s else permission. That would be fair, right?

Main sources: here, here and here


The key role of Fisheries Information Systems by Francisco Blaha

Following on my post on the Ideal Processing State set up for a CDS, I follow here on the key role Centralised Fisheries Information Systems (FIS), based on what I wrote in our recent FAO book for a CDS and that I adapted a bit for the Pacific context for a report I have done for FFA.

Before coding there is always planning and paper

Before coding there is always planning and paper

There are numerous advantages in a complete and effective centralised fisheries information system for a regional fishery organization in terms of MCS, science, management, economic intelligence, assets management just to name a few. In the context of PSM in general and CDS in particular, the effectiveness of a FIS is fundamental, yet it has to cater to a specific set of needs, mostly not available in the present systems.

Specific FIS requirements for PSM and CDS

For any regional fisheries organizations, the specific set of needs to be covered refers to traceability and catch accountancy in particular in countries that are port and processing states. 

The FIS should be able to incorporate three basic functions in terms of supporting CDS: 

  1. ensuring that no illegal products enter the territory; 
  2. providing a national traceability system that rapidly identifies fraudulent economic operators by means of detected mass-balance inconsistencies; and 
  3. validating trade certificates covering consignments exported from the territory.

Integrations of Landing controls

Port /processing states have a duty to ensure that no illegal product in any form is imported, whether landed as catch or imported commercially. 

When products are imported into a processing state, it must ensure that data relating to the consignment, products and certificates are recorded in the CDS.

Such systems enable processing states to identify sources of mass-balance inconsistencies detected by CDS through certificates when attempts are made to ship more product out of a country than was imported. In the absence of centralised traceability systems, and depending on the size of the processing industry, identification of fraudulent operators in national supply chains systems could be impossible.

Once products are cleared to enter a port / processing state, the need is to trace: i) buyers of products covered by particular certificates; ii) product distribution and transformation into value-added goods; and iii) the consignments in which they are re-exported. The ultimate aim is to ensure that the transactions tally to account for the entire amount of product.

Six KDEs (Key Data Elements) constitute the core data of a national traceability system:

  1. product source – seller and previous owner of the product;
  2. product destination – buyer and new owner of the product;
  3. species;
  4. volume;
  5. product form; and
  6. certificate number.

Of course, in port states where transshipments are the norm, mass balance is relatively simple as most “fish in” accounts for “fish out” in one or more carriers. If the product is landed for containerization and direct exports only, a similar scenario applies. However, if the unload is separated in different batches according to size, weight, ecolabelling status and from then on different “batches” have very different destinies. The FIS needs to account for these scenarios

A batch of products changing hands may be covered by more than one certificate, but the information to be recorded in the traceability system is certificate-specific. If, for example, a batch containing product from three certificates has been mixed and is being sold, the information to be logged for the transaction must still establish three individual certificate-specific records – not a single new record that would necessitate a new certificate number.

Because people often think in terms of product batches and consignments rather than product volume that may be split or mixed, it is essential to clarify whether the national system traces batches of product through the supply chain and hence ensures their integrity. There are many reasons why batches have an important role in processing.

But because landings under particular certificates may consist of different species and different product sizes, a landed batch may immediately be broken up among several buyers – even though it is covered by the same certificate. And as product moves through the supply chain, “sub-batches” may be further distributed among economic operators. At the other end of the supply chain, semi-processed or processed goods may be mixed with product originating from other certificates, thereby merging several initial batches into a new batch for export certification.

Any traceability system is concerned with:

  1. the volume and form in which a particular species enters the supply chain under a certificate;
  2. the volume and form of that species exiting the supply chain under that certificate; and
  3. knowing every stop through which the different volumes and forms have moved within the supply chain.

Hence traceability systems are programmed to trace the volumes of particular species and products rather than batches that enter supply chains under particular certificate numbers. It can follow these volumes as they are split or merged any number of times, and it can follow changes of form and processing losses affecting the species concerned. Every time a batch moves forward in a supply chain, the transaction, original certificate numbers, species, volume and form are recorded and deducted from the lot of certified products that originally entered the same supply chain stop.

Points in the supply chain where integrated tracing is necessary

Traceability records are created at the beginning and end of any supply chain stop.

Economic operators in national supply chains acquire a batch of product, which may be covered by a single certificate or several, and must record the products, volumes, forms and certificate numbers. This record identifies the source of the products, and must match the exit record logged by the previous economic operator. Such a record may be seen as a “product account” owned by the buying establishment, which can now process and sell or export the products. These will be logged again in the same traceability system at exit.

System attributes

Certain attributes of national traceability systems determine their effectiveness and whether they will be accepted by the industry. They must be:

  • user-friendly, simple and intuitive so that its users quickly learn to operate them effectively; record-keeping may be based on official templates and guidance set out in a user manual; these may be in online formats;
  • results oriented with clear statements of expected results, and all functions should serve these results; this ensures that the system will not become complicated and hence prone to failure;
  • tamper proof, providing a high level of data security, especially in online systems; the fishing industry is particularly sensitive with regard to commercial records, which must remain confidential; and
  • grounded in legislation so that sanctions can be enforced in cases of noncompliance; in the absence of a legal foundation, non-compliance cannot be sanctioned and the system will fail.  

An official online platform in which operators and authorities record their data is always the prefered option. One advantage is that it does not require specific software to be set up at the operator level, so any operator can access the system from a standard computer with an online connection, create a user profile and start using it. Another advantage is that upgrades are greatly facilitated. Electronic platforms largely eliminate the need for paper communications between a competent authority and the private sector because all data can be handled electronically. Such platforms can also serve to issue trade certificates, which is especially useful if the CDS has no electronic system for doing so.

At least two user groups are defined in electronic platforms: i) private-sector operators who input data and submit requests for the validation of certificates; and ii) competent authorities, who exercise oversight, analyse data and validate certificates.

Functions of electronic platforms – user groups

Electronic platforms are more versatile and more powerful than simple record-keeping solutions. They handle data from landing, importation, distribution, ownership and exportation centrally in near-real time, thereby enabling competent authorities to track how much product is entering a country, who acquires it, how much a company holds in its inventory, what is being processed into what and how much is being exported.

For economic operators, the following functions are essential:

  • Login and system overview. A user ID must be required to access the system, at which point an initial page gives an overview of pending submissions and requests and validations by business partners and the competent authority. From here operators can access all functions of the system.
  • Product entry and creation of product accounts. Operators must create product accounts that link product entry to premises with the covering certificates. Supporting documents such as landing or import declarations, catch certificates and invoices must be uploaded: competent authorities will validate these and authorize the creation of the product account. All processing runs and product sales are then deducted from such accounts until depletion. Busy operators will use large numbers of such product accounts.
  • Product exit, subtraction from the product account and certification. Operators can generate products and prepare them for exit from their premises with trade certificates mandated in CDS. Operators can sell products in the same form or in pre-processed form to other economic operators in business-to business transactions in the same territory and market, or they can export processed products, or they can sell the obtained end-products for domestic consumption in the same territory. The details of such processing runs are logged into the system, providing product account number, species, form, volume used and volume resulting. The resulting product is deducted from the product account. These options are detailed below:
    • Business-to-business transactions. Buyers log acquired raw materials in the system, uploading copies of invoices, catch certificates and original product account numbers, which are shown in invoices. Sellers see a request to validate a sale, and the products are deducted from the sellers’ product account; a new product account is created for the buyer. For a transaction of this kind no certificate is generated or validated and there is no need for validation by competent authorities. The platform ensures the integrity of buyer-to-buyer transactions, and accurate debiting and crediting of the respective product accounts.
    • Export transactions. Processing information is logged by operators with reference to the source product accounts for the raw materials. This is based on consignments being prepared for exportation rather than individual processing runs. For every product account operators log volumes, forms and species processed and the amounts of resulting product obtained. The system can then calculate and log processing yields, and signal if a yield anomaly is detected. Supporting documents – bills of lading, export declarations and commercial invoices are uploaded in support of submissions, which result in requests for trade certificate validation by the competent authority. When this is done, operators can pick up a printed, signed and stamped original at a designated office. 
    • Domestic market transactions. The system records sales of products into a domestic market, either directly – which is unusual – or through wholesalers or retailers. This is also logged by consignment and is entered in the same way as a business-to-business transaction: buyers input the data and have them validated on the platform by the seller. These records close the loop at the domestic end-market blind spot, but they require wholesalers and retailers to participate in the system. These transactions require validation by competent authorities and result in “inward trade” certificates issued to domestic buyers. Such certificates are not mandated in CDS, but should be mandated in national CDS-supporting traceability mechanisms to ensuring that all product volumes leaving premises are traceable and reconcilable.
  • Product account balance. The system must automatically compute the remaining balances in product accounts until depletion of individual accounts; a query function should be available (see next).
  • Queries. The system should enable any operator to query all aspects of acquired CDS-covered products. This must cover product in storage or processed at a facility and must include past production runs, shipped consignments and product account balance status by species, form and certificate numbers to provide a full overview.
  • Error correction. The system must enable operators to correct data errors.105 Operators must be able to correct data that are as yet un-validated, and if data have already been validated, operators must be able to correct them with the agreement of the validating counterpart.

For competent authorities, the following functions must be available:

  • Login and system overview. Competent authorities must be able to access the system. An initial screen should show all pending validation requests, their status in case several users are simultaneously accessing the platform, and system-generated alarms. Various options should be available to enable users to navigate to functions relating, for example, to queries and blocking documents.
  • Validation of actions and requests. The first function of the system is to forward validation requests from economic operators to the relevant competent authority. The three groups are: i) validation for product account creations such as buyer product entries covered by CDS certificates; ii) validation of trade certificates; and iii) validation of error correction requests. The platform enables competent authorities to view supporting documents so that verifications can be undertaken before validation is granted.
  • Queries. This powerful function enables competent authorities to view the product accounts, individually or in groups, of individual economic operators, clusters or an entire national sector. Queries must make relevant information accessible to competent authorities so that they can monitor domains of interest and historical data. Interfaces can be designed that enable users to make queries that combine any type of stored data.
  • Document blocking. This important feature enables competent authorities to suspend or block documents such as product accounts or trade certificates submitted for validation. Suspension occurs when an inspection is ordered to ensure that products cannot legally be exported. Blocking occurs when products in a product account or draft trade certificate are denied movement along a supply chain because fraud has been detected. Without such a mechanism competent authorities would be unable to use the traceability platform for law enforcement purposes, and could only rely on for information.

Functions of the electronic platform – calculation routines and alarms

The platform will be designed to execute a number of functions. The most important are:

  • Automated product-flow monitoring. The mandated data-logging routines of economic operators for sequential handling of products along national supply chains feed into the automated product-flow monitoring process. Product is credited to a buyer’s account during an acquisition transaction and is deducted from the same account when it is sold on to the next buyer. Inconsistencies can be detected immediately, just as CDS detect inconsistencies between importation and exportation. The platform monitors the product flows of individual economic operators and detects inconsistencies at this level. The platform does not have to establish the integrity of transactions involving several operators or certificates. If successive domestic transactions relating to a specific certificate are satisfactory, the balance between entry and exit at the country level is also satisfactory.
  • Processing yields. The system must be capable of capturing all processing yields on the basis of volume declarations for product form “in” and product form “out”.  The platform then establishes a database of processing yields based on species, original form, resulting form and yield factor. Statistical analysis then establishes the related mean processing yields/losses. Yield factors will fluctuate around the mean according to product quality, seasonal fluctuations of species condition indexes and the skill of factory workers to produce a normal distribution around the mean. The system can generate an alarm when a production run submitted for certification exceeds the mean by a given number of standard deviations.
  • Automated alarms. The system must trigger alarms when anomalous data are logged into the system. Alarms must primarily alert economic operators: if they try to log a transaction that is inconsistent – more product than available being input for sale, for example – they must be able to rectify the situation. In cases of mass-balance inconsistency, the system must be able to reject the submission and automatically enforce the mass-balance integrity rule.108 In cases of excessive processing yields, users may decide whether they will be justified at a later stage in case of queries by competent authorities. If erroneous data input leads to automated submission denial, the need for intervention by competent authorities is reduced substantially. Operators must ensure that their bookkeeping, inventory management and data submission are accurate.

Where is the sustainable seafood ecolabelling business going? by Francisco Blaha

Any scientific paper that starts with: “The sustainable seafood movement is at a crossroads. Its core strategy, also known as a theory of change, is based on market-oriented initiatives such as third-party certification but does not motivate adequate levels of improved governance and environmental improvements needed in many fisheries, especially in developing countries. Price premiums for certified products are elusive, multiple forms of certification compete in a crowded marketplace and certifiers are increasingly asked to address social as well as ecological goals”, will have my immediate attention.

L1000706.jpg

This paper "Evolution and future of the sustainable seafood market", written by an interesting and mixed bunch of people from the US, Netherlands and Norway, traces how the sustainable seafood movement has evolved over time to address new challenges while success remains limited. We conclude by exploring four alternative potential outcomes for the future theory of change, each with different contributions to creating a more sustainable global seafood supply.

My views on ecolabelling are quite public and normally an area of contention with some of my colleagues in industry, yet my criticism is as always to make them better (at least in my personal opinion) not to make them disappear (even if all ecolabels are finally successful, then there would be no reason to differentiate sustainability, and they will reach a natural death after succeeding)  

In any case, please read the original and reach your own conclusions. I as usual just quote some parts

Intro
The global sustainable seafood movement’s original strategy, known as the theory of change, proposed a demand-driven approach to biological and ecological improvements in seafood production systems. This ‘market-based’ approach largely resulted from non-governmental organizations’ (NGO) frustration with the perceived inability of fisheries regulators globally to mitigate overfishing, as evidenced by the collapse of cod in NewEngland, an increasing number of overfished US fish stocks and global declines in highly pelagic species. Although improvements in fishery governance have led to reductions in overfishing and rebuilding fish stocks over the past 20 years, many of the concerns that led to the seafood movement remain unresolved, especially in developing countries, and are now exacerbated by new climate related threats to the world’s ocean resources (for example, acidification and rising ocean temperatures).
The investment made in these NGO led programmes was based on two general assumptions: first, that information is key in driving consumers to select environmentally sustainable sources of seafood, and second, resulting shifts in demand will, when transmitted down the value chain to the production sector, provide an economic incentive for improved fishing practices and fisheries management.
These early initiatives built directly on a theoretical basis of credence product attributes, like sustainability, that are not verifiable through direct consumption and hence create information asymmetries between buyers and sellers at all levels of the supply chain. Sustainability, in the context of seafood, is both complex and imperfectly measurable. The MSC, for example, defines sustainability as seafood sourced from fisheries that leave enough fish in the ocean, respect habitats and ensure people depending upon fishing can maintain their livelihoods15. The ASC defines responsible farming practices as those that address the key environmental impacts of farming, set requirements for workers’ rights and protect communities surrounding certified farms.
Ecolabels and recommendations are created as ‘abstract systems’ of communication, to create trust and security for consumers in production systems that are removed from their daily experience and that are too complex and incomprehensible to communicate in full detail. However, because sustainability is both subject to differences in interpretation and imperfectly measurable, the criteria used by certification standards and recommendation lists are open to broad interpretation, therefore contested between NGOs driving further proliferation of definitions and sustainable seafood programmes.
The proliferation of these claims and ecolabels has now led the sustainable seafood movement to a crossroads. More than 30 seafood guides and certification programmes developed by NGOs, in addition to governmental certification schemes and community supported fisheries, contribute to a crowded ‘seascape’ of consumer- facing advice. A growing body of evidence suggests that this seascape of sustainable seafood programmes available in the global seafood marketplace has brought new challenges to achieving more sustainable fisheries and aquaculture production.
For example, as sustainability criteria are imperfectly measured and open to interpretation, the ability of NGOs to coordinate credible and measurable metrics for improvement is impeded, adding a broad sense of confusion amongst consumers and buyers alike. There is in fact limited empirical evidence that substantial changes in consumer demand for sustainable seafood have occurred. Producers are also directly affected because they incur the costs of complying with different seafood programmes aligned to different importing markets. Incentives for compliance also remain unclear, given there is little evidence that price signals are seen by producers, or that any changes in demand have resulted in substantial environmental improvements.
In addition, the proliferation of sustainable seafood programmes appears to lead to a number of potential challenges that remain less clearly articulated in the literature. The effect depends on the degree of heterogeneity in the labels and the overall objectives of the schemes. For example, a previous study demonstrated that the presence of several standards initially can be beneficial as the scope of an environmental problem is unknown and public recognition is poor, but over time fewer labels are preferable as environmental performance improves. Others have shown that there can be virtuous competition or a ‘race to the top’ between schemes as they refine their claims and methodologies to be the best in class. Conversely, a ‘race to the bottom’ may ensue if schemes seek market  share over performance.
In this paper, we review how the theory of change for sustainable seafood has evolved over the past 20 years. We identify in more detail current challenges sustainable seafood programmes face today, as well as potential future directions to address those challenges. Our review indicates that coordination and signaling failures of the early phases of the movement continue 20 years later, undermining the delivery of durable and global environmental improvements. In doing so we go beyond normative questions of the economic efficiency of seafood ecolabelling programmes and the relative contribution of labels to sustainability.
We instead offer four possible future scenarios: status quo, race to the bottom, state intervention and risk mitigation. The first two scenarios trace possible outcomes of no further evolution in the theory of change and the environmental consequences that may result. The third scenario considers an increased role for governments in the certification marketplace. The final scenario outlines the role of a new actor within the supply chain bearing financial risks associated with assuring the sustainability of seafood in the market.
New routes to sustainable seafood
Creating an incentive to deliver sustainability as a credence product attribute in the global seafood market when regulatory efforts by governments are deemed insufficient to significantly improve fisheries management requires greater coordination than once thought.
Extra-transactional actors like NGOs continue to play a central role in re-aligning practices to mirror or materialize norms and values in sustainability, through efforts to educate seafood consumers and the public about seafood production practices and environmental impacts, and by supporting programmes to assess sustainable seafood. Building on insights from economics, political science and sociology, we show that coordination failures persist over the three iterations of the sustainable seafood movement’s theory of change. The future of the theory of change is one which can either:
  1. be steered to avoid, or at least minimize, coordination failures in supporting producers to deliver credible sustainable seafood, and subsequent continued environmental improvements; or
  2. continue to devolve into a race to the bottom in standards in which environmental improvements are eroded.
Philanthropic foundations and NGOs have recently been focusing on new or improved sustainability programmes and determining if existing certification programmes or guides meet a common benchmark. Instead of continuing such pursuits, our review shows the need for a new form of coordination if the theory of change is to meet its goal of creating substantial, global, positive environmental changes in fisheries and aquaculture production. SSAs (‘sustainable seafood aggregator’) may resolve the coordination problem and reduce transaction costs currently incurred in the supply chain, by more efficiently and reputably providing recommendations of purchase of sustainable seafood from fisheries and aquaculture. SSAs are also flexible enough to adopt new requirements, like the inclusion of indicators for social responsibility. This approach is also applicable to other products sold with credence attributes in the global market including cocoa, coffee and forest products. While not termed SSAs or bearing all the same characteristics of what we propose here, similarly hybrid forms of coordination and NGO partnerships are emerging in other sectors (for example, the cocoa markets in West Africa).
Certifying sustainability for the market is premised by the original and subsequent versions of the theory of change to induce market actors (buyers, retailers and consumers) to choose seafood identified as sustainable. Resulting economic incentives for producers and governments to improve regulatory and environmental performance will remain central to any future theory of change in the sustainable seafood movement. Alternative modes of delivering these incentives for change that both reduce costs and increase the capabilities required to access markets demanding verification of sustainability are needed to facilitate multiple improvement trajectories for producers. This points to a shift in the roles that extra-transactional actors, including both NGOs and governments, play in markets demanding credence attributes.

What are we talking when we talk of the global footprint of fisheries? by Francisco Blaha

Back in February, I blogged about a paper on the tracking the global footprint of fisheries, that was quite illustrative of that fact… but I also blogged later on in regards the controversies this paper was causing.

Obviously much smarter than me people had also issues with the paper and the claim that "vessels are now fishing in 55% of the world’s oceans, which is an area four times larger than occupied by onshore agriculture" and put their brains into it. They just publish a comment on that original paper.

Fig. 1 Effect of grid resolution on the perception of fishing footprint. The areas in dark blue show the trawling footprints estimated for 2016 with (A and C) an equal-area grid with 0.5° resolution at the equator; (B and D) an equal-area …

Fig. 1 Effect of grid resolution on the perception of fishing footprint. The areas in dark blue show the trawling footprints estimated for 2016 with (A and C) an equal-area grid with 0.5° resolution at the equator; (B and D) an equal-area grid with 0.01° resolution at the equator.

Their reanalyses of their global (all vessels) and regional (trawling) data at higher resolution reduced footprint estimates by factors of >10 and >5, respectively. The fact that they also illustrated their work with the South Atlantic (where I started fishing) was an extra bonus. 

Based on this analysis, less than 4% of the global ocean is fished, not 55% as reported in the original paper.

Interestingly, the revision of the data is based on the same questioning I had on a paper on the Rise of the DWFN, where the “definition” of the scale of analysis could provide very different data.

Personally, I don't like to imagine this "comments on papers" as discrediting in between scientist, but as a way to get to more accurate results, in a field that is just being developed with every IAS data-based papers, perhaps a tacit agreement of what resolution to use is the way to go. This is science at work! May not be good for egos, but lead to a better understanding and more transparency... and that can only be good!

Anyway…. below I quote parts of the response… but read the original comment.

Kroodsma et al. (1) used automatic identification system (AIS) data to track vessels they classified as “fishing” and estimated that fishing activities occurred in 55% of the world’s oceans in 2016. We show how strongly their results depend on the spatial scale of analysis. Their method gridded the ocean into large cells of 0.5° at the equator (~3100 km2) and counted every cell with any assumed fishing event of any duration in 2016 as fished, thus contributing its total area to fishing footprint.
We accessed the 0.01° grid fishing data made available by Global Fishing Watch (2) and reanalyzed these data at resolutions of ~3100, ~123, and ~1.23 km2 (corresponding to 0.5°, 0.1°, and 0.01° at the equator), giving footprint estimates of 49%, 27%, and 4% of ocean area, respectively. Thus, higher-resolution analyses reduced their global fishing footprint estimates by a factor of >10. Our estimate of footprint at 0.5° (49%) differs from that reported by Kroodsma et al. (55%) because they improved their algorithm to identify fishing by squid jiggers after publication and updated data in the current release. Also, the method we used to reallocate fishing activity to grids differed slightly from that in Kroodsma et al., leading to small differences in absolute footprint estimates, but these do not affect the relative relationships between footprints across spatial scales.
All human activities have diffuse impacts that extend beyond the area of activity. However, for fishing activities, using a spatial grid of an arbitrary low resolution does not provide an appropriate or consistent quantitative assessment of diffuse impact. For example, some diffuse impacts would be assessed more effectively using catch and bycatch data and population or community analyses that account for the diverse movements and life histories of affected populations and species, as well as the different rates of mortality that result from their varied interactions with fishing activities (46).
We also quantified the effects of grid resolution on trawl fishing footprints with the Global Fishing Watch data (2). We focused on trawling because footprint is a consistent and well-defined concept for trawling vessels, which tow a net or nets directly behind the vessel(s) and for which gear dimensions are known or can be estimated more reliably. Further, high-resolution footprints for bottom trawling (although Kroodsma et al. did not distinguish bottom trawls from trawls that do not contact the seabed) have long been used as metrics to assess fishing impacts on seabed habitats [e.g., (79)].
To illustrate the effects of grid resolution on trawling footprints, we considered regions of the north Pacific Ocean and off southern South America. For each region, trawling footprint (as proportion of the ocean area) was calculated using equal-area grids of 0.5° and 0.01° at the equator (Fig. 1). At the higher resolution of analysis, the estimated footprints in these regions fell by factors of 5.3 (48% to 9%) and 5.9 (29.5% to 5%), respectively. Further, if we take as an example a region of the north Pacific Ocean where trawling was banned in 2016 (10) (Fig. 1, A and B), then 100% of this area (59,000 km2 of ocean) was incorrectly classified as trawled at 0.5° resolution. For such reasons, many published analyses of trawling footprints are conducted at higher resolution (1113).
A coarse gridding of the positions of fishing vessels (globally or regionally) that ignores differences in catching power among vessels and gear, or ignores the scale of their direct and diffuse impacts, leads to footprint estimates that are primarily driven by the spatial resolution of analysis. Such analyses are unlikely to be a good proxy for the footprint of fishing or the status of species or ecosystems affected by fishing. The high temporal resolution of AIS data can provide valuable insight into the behavior of individual vessels and allowed Kroodsma et al. to classify different types and patterns of fishing activity. These analyses alone are an interesting achievement, but the footprint estimates and comparisons with agriculture highlighted in their report are misleading.


Open registries and tax heavens, the perfect combo for IUU fishing by Francisco Blaha

There was a lot of coverage on the news last year on the Paradise and Panama papers, as an insight on the intricate ways in which financial secrecy jurisdictions (tax heavens) lead to reduced transparency, and any lack of transparency is of immediate attraction to fiheries operators where transparency is something you don't want.

Photo serves an illustrative purpose and was not taken in the context of IUU fishing

Photo serves an illustrative purpose and was not taken in the context of IUU fishing

In my experience, if you dodgy… then you are dodgy for most things. This however don't imply that you are a mean person aat the same time. Over the years I meet quite dodgy characters in fisheries that are quite nice and affable people, is just that they don't really play by the rules… while others (the lesser in my personal experience) are real devious characters and make a point to play the system and sink anyone on their way.

But basically, if you re going to be underreporting, or setting on areas not allowed, or finning on the side or other 1000 things you can do in fishing… chances are you go for jurisdictions to flag your vessels that don't really take much responsibility and you do your business in places that not particularly transparent.

As a IUU fisheries operator if your flag state has an open registry and is a tax heaven at the same time, you hit the double bonus!

The correlation in between this two issues, while known, it wasn't studied a lot until this paper came along “Tax havens and global environmental degradation” authored by a group of very clever people loosely related to the Stockholm Resilience Centre (I wrote about them before).  The paper looks to the bigger picture in between fisheries and degradation of the Amazonian forest.

I’ll focus on some of the aspects of fisheries quoting below, but as usual, read the original!

The role of tax havens for global fisheries
The fisheries industry is a global business, with owners, fishing companies, customers and other actors in the value chain spread across the world. The global nature of fisheries value chains, complex ownership structures and limited governance capacities of many coastal nations make the sector particularly susceptible to the use of tax havens in three important ways.
First, the use of these jurisdictions has been proved to support aggressive tax planning and tax evasion. Common strategies to avoid taxes include exporting and re-exporting fisheries products under incorrect article codes via subsidiaries, or selling to the tax haven subsidiary at a highly discounted value and then re-exporting to the real customers at the full value. Unreported sales and recategorization of sales income as agency fees charged by a subsidiary located in a tax haven represent additional ways by which seafood companies have been documented to avoid taxes.
Second, these jurisdictions also facilitate the evasion of regulation designed to address overfishing and fisheries crime by exploiting loopholes created by the fact that many well-known tax havens also qualify as secrecy jurisdictions in other regards, such as flags of convenience (FOC) states. FOCs are countries to which vessel owners flag vessels and from which they can expect limited or no sanctioning mechanisms if they are identified as operating in violation to international law. Recent findings indicate that some of these vessel registries are run by private entities, further reducing transparency and the ability of governments to exercise formal and informal pressure directed at FOC states. By setting up company structures with subsidiaries in jurisdictions that are both FOCs and tax havens, companies can obfuscate profits and beneficiary ownership of subsidiaries and individual vessels.
This has implications for illicit activities, linking to the third point — namely, that the secrecy afforded by combined use of tax havens and FOCs also allows companies to secure the dual identity of a fishing vessel, one of which is used for legal and the other for illegal fishing activities. Historical examples of IUU fishing from the Southern Ocean illustrate the destructive combination of tax evasion, hidden beneficiaries, falsely allocated catches and the resulting depletion (or, in the instance of South African stocks, collapse) of fish stocks, as well as reduction of critically threatened seabird populations.
Our analysis combines multiple datasets on fishing vessels and flag information to specifically highlight the link between IUU fishing and tax haven jurisdictions. While only 4% of all registered fishing vessels are currently flagged in a tax haven jurisdiction, data from regional fisheries management organizations and the International Criminal Police Organization (INTERPOL)34 show that 70% of the vessels that have been found to carry out or support IUU fishing and for which flag information is available are, or have been, flagged under a tax haven jurisdiction — in particular, Belize and Panama (Fig. 1).
Fig. 1 | Fishing vessels and tax havens. Number of registered fishing vessels globally in the FAO Fishing Vessels Finder database (n = 257,798)33 compared with the number of vessels that have been found to carry out or support illegal, unreported an…

Fig. 1 | Fishing vessels and tax havens. Number of registered fishing vessels globally in the FAO Fishing Vessels Finder database (n = 257,798)33 compared with the number of vessels that have been found to carry out or support illegal, unreported and unregulated (IUU) fishing activities(n = 209)34. Dark blue wedges show the percentage of vessels flagged in tax havens. The bar plot displays the count of IUU vessels that are, or have been, flagged in the different tax havens, where asterisks indicate overlap between tax haven jurisdictions and flags of convenience (FOC) states

The use of tax havens — and its associated problems such as loss of tax revenues, reduced transparency and lack of compliance — make tracing of fisheries resource use and allocation of accountability extremely difficult and costly. As such, it represents a major threat to the sustainability of global ocean resources that should be acknowledged and taken seriously. 
Putting tax havens on the global sustainability agenda
The lack of clearly established causal links between capital flows via tax havens and environmental change should not deter from further investigations. Instead, we hope that our analysis triggers important questions for those interested in the implications of tax havens for global environmental sustainability. For scholars, the questions centre on causality and the importance of legal and illegal capital flows. That is:
  • To what extent does the use of capital channelled through tax haven jurisdictions allow companies to expand their extractive operations in ways that they would not do otherwise? In particular, to what extent does the use of tax havens allow companies to circumvent environmental regulation and accountability?
  • Does the use of tax havens by multinational corporations lead to underreporting of inward FDI into extractive activities affecting important global environmental commons?
  • Are these jurisdictions used to a different extent in different extractive sectors, and if so, why?
  • If losses of tax revenues are substantial over time, do these undermine national and regional monitoring and enforcement capacities that would help safeguard important global environmental commons.
No Panamanians on board! (Photo serves an illustrative purpose and was not taken in the context of IUU fishing)

No Panamanians on board! (Photo serves an illustrative purpose and was not taken in the context of IUU fishing)

The nexus between illegal fishing and fisheries subsidies by Francisco Blaha

L1000706.jpg

I have not had a "guest" so far in this blog, but I do today. I have known Bradley Soule for a few years now, he is the Chief Fisheries Analyst at OceanMind. I worked with/for him in Thailand, as his group is being pivotal on the advances regarding PSM and general MCS there.

He a good man and very genuine, and as a former US Coast Guard man, he really loves and cares for the ocean. We also share a profound dislike for fisheries subsidies, lack of transparency and unfairness in the application of the rules.

He wrote a recent blog entry on the OceanMind blog that I liked a lot as he touched on subsidies and IUU, (a topic I wrote about here),  hence with his approval, I quote below the full text of his post.

If you read the most recent update to FAO’s Status of World Fisheries & Aquaculture (and if you’re reading this, you probably did), you know that the trend lines for world capture fisheries aren’t great. The total amount of capture harvest has been static for decades but the percentage that is overfished continues to grow and amount of underfished fisheries (think of it as spare capacity) continues to drop. While the majority of world fisheries are still sustainability harvested, the trend lines aren’t great. This makes sense in world with millions more people every day and a larger percentage of those people entering the middle class and demanding access to the same tasty protein that the rich world has enjoyed. As we all know from economics, static supply and increasing demand means that prices will rise, and where prices rise incentives rise for people to break the rules or cheat or for governments to set the bar too low and enable legal overfishing.
OceanMind primarily helps governments and businesses address the first issue by providing intelligence reports on possible non-compliance for investigation or 3rd party validation that everything is fine for businesses. We also work with fisheries authorities to develop and implement regulations that enable sustainable fishing based on vessel activity in their waters.
In previous work with the Coast Guard, I had the opportunity to participate in a very small way in the review and development of the Port State Measures Agreement (PSMA), which took about a decade. That gave a good viewpoint into how complicated these issues can be, but that process doesn’t hold a candle to the ongoing WTO deliberations for subsidies which probably have an even greater likely impact on global fisheries sustainability that the PSMA.
I will readily admit that trade issues are not my area of expertise, but I did my best to look through the current working language as it related to IUU fishing and I want to share a few of the key issues I see with my hopes and recommendations for how it all pans out.
First off, the definition of “IUU fishing” is problem number one. There is a clear desire to not provide subsidies to vessel operators engaged in IUU fishing, but how do you decide who has done it? Illegal, unregulated, and unreported (IUU) fishing has a very specific and technical definition under international agreements which is actually quite broad, but in practice it’s been rounded down to a simplistic view that the only IUU vessel is one that is on the IUU list of a regional fisheries management organization (RFMO), one of the international bodies where countries jointly manage highly migratory or fish stocks that are shared across borders. It’s also important to know that these are NOT managing the majority of the worlds fisheries, which are mostly inside national waters. Violations of the rules inside national waters may lead to sanctions or penalties, but very rarely do they lead to designation of an IUU fishing vessel under an RFMO list. Using just these lists would be the lowest common denominator in deciding whose subsidies should be removed or withheld.
However, if we don’t use the IUU vessel lists, what is the best indicator? We are literally talking about taking money away from people. Personally, I think there should be as few subsidies as possible in fisheries, but in the absence of a complete prohibition, any allegation of IUU fishing should lead to subsidies being placed in escrow or withheld pending investigation by national authorities. This will not be as simple as using the IUU vessel lists, but it captures the full range of IUU fishing activity and can lead to actions that really push people where it matters: in their wallets.
It’s also important to make sure that any penalties are targeted at the people and companies profiting from the activity in question. As we like to say in the compliance world: “boats don’t break the rules, people do”. There is a lot of depersonalization of IUU fishing given the focus on vessels where we speak as if a vessel had a brain and knowingly went into a closed area with prohibited gear or fished beyond the end of an expired license. This is obviously ridiculous but it’s how almost every press release in the world reads for fisheries violations. Any meaningful attempt to sanction fishing subsidies based on IUU activity should therefore target the beneficial owner of the vessel, who may have different types of subsidies in play, including subsidies for fuel and tax reliefs that are also currently open to negotiation.
Finally, all of this would be much simpler if national authorities made public their vessel registries, fishing licenses, and lists of subsidy recipients. OceanMind spends quite a bit of time helping governments and businesses research ownership and flag registry information using our extensive databases as well as developing new relationships and sources to overcome the silos of information that discourage cross-border cooperation on fisheries intelligence and enforcement. The compliance community does not do a good job of reminding everyone that the low-hanging fruit of fisheries compliance is in making sure that registries, licenses, and subsidies are publicly available so that other countries, the public, and even government officials within the same government can see how their tax money and common marine resources are being used. Once the information is more freely available, there is still the task of conducting analysis to dig through the data to find out where the problems might be (the real fun stuff), but that’s a discussion for another time.
Thanks again to ICTSD and the WTO for hosting me for this discussion and I look forward to seeing a strong, transparent, and enforceable agreement text in the near future!
Anyone interested in discussing my perspective is welcome to get in touch via info@oceanmind.global.


The bigger picture of transhipping in ports by Francisco Blaha

A big part of my work these days goes around the interface of general MSC, PSM best practices and transhipment monitoring in ports. As I wrote before, transhipment is a reality of our industry and transhipment in port should be the norm, since a layer of regulatory and “fish accountancy” oversight can be added. 

Sellers to the Purse Seiners in Rabaul (PNG)

Sellers to the Purse Seiners in Rabaul (PNG)

 Now the impact of transhipment activities for the ports that host them is an area I been interested. As anything else in fisheries (and in life) everything has advantages and disadvantages, so we can go from fish leakage, impacts on food security, via potential market for local fruits to venereal disease at the other end.

Not much has been done in researching these issues in a systematic way, so I always keep an eye on the topic. And this new paper fits right in, and what is even better is by 3 author I know (and like as peoplePhilip A.S. James from SPC, Alex Tidd (who’s work I already blogged about), and Lotokufaki Paka Kaitub from Tuvalu where I was recently working, and place I like (in fact I was hoping to work on long-term basis there, but I did not got the job).

The paper by my colleagues “The impact of industrial tuna fishing on small-scale fishers and economies in the Pacific” focus on transshipments (I would have added that to the title) in Funafuti lagoon and is good read, tackling the original is always recommended.

Their paper looks to address this gap in the literature with an initial analysis of the impact of transhipping on the willingness of fishers to go fishing in Funafuti, a small but important transhipping port. They go onto use this modelled relationship to estimate potential losses with the artisanal fishery as a result of transhipping activity.

Below I quote the bits I like the most:

The scientific literature indicates that there are some impacts on the availability of oceanic pelagic resources to small-scale fishers as a result of industrial vessels fishing in local waters, particularly when they are close to shore [14,15,24–27]. Leroy et al. [15] commented that ‘industrial purse-seine fisheries may impact upon artisanal and subsistence fishers by reducing local fish availability’, and SPC [26] found that industrial vessels ‘largely catch similar sized fish to the artisanal fleet’, suggesting that the two fisheries fish the same portion of the stock.
However, SPC [26] do not suggest that industrial vessels directly impact the catch of artisanal or subsistence fishers.

I tend to agree with that, based on what you see in the local markets and the gear used for fishing

Anecdotal evidence supports the conclusions from the literature and suggests that many fishers believe that industrial fishing is depleting stocks of coastal recourses (authors’ discussions with a range of Pacific Island communities). In Tuvalu, data collectors, Fisheries Department staff, and fishers have all described the same pattern: the presence of industrial vessels means that fewer artisanal fishers go fishing and catches are reduced. 

Again, I agree… if I can go by the side of the vessel and barter some brine frozen skipjack in a couple of hours, that then I can resell at the market later on albeit at a lower prices than better fish that could have taken me the whole day to catch, I may not do it… unless I have clients that will pay much better money for fresher fish – believe me – brine frozen skipjack isn’t a treat. Now how prevalent that willingness to pay for good fish is in low-income pacific island ports, is something I don't know

Abernethy et al. [17] describes our understanding of small-scale fishers’ behaviour as ‘at best rudimentary’, yet this underpins fishers’ day- to-day decisions, and without a basic understanding of the behavioural dynamics, policy will be inefficiently designed and likely to fail. Muallil et al. [18] also call for a greater understanding of the factors impacting a fisher's willingness to exit a fishery. Developing data-driven evidence and understanding the behavioural drivers of artisanal fishers and the impacts of their behaviour is important, and policy-makers need to fully understand these trade-offs when making decisions.

As an ex-fisherman, I could not agree more to the fact that scientists and policymakers do not usually have a full grasp on fishers behavioural dynamics. many time I been confronted by solutions that will go at the core against the grain of what fisherman will normally behave on the "2nd-degree" decision making (a decision you make while evaluating various levels of options)

The difficulty in quantifying interactions between artisanal and industrial fisheries is largely due to poor artisanal catch data [15]. At the Pacific Community (SPC) Head of Fisheries meeting in 2011 Tuvalu placed a high priority on understanding the potential for interaction between regional tuna fisheries and local artisanal fishing [24]. As a result, SPC provided support for artisanal catch monitoring in Tuvalu in 2013 to address critical data deficiencies and allow improved investigation into the interactions. This dataset provides a unique opportunity to investigate the interactions between artisanal and industrial vessels from a social and biological perspective. We use this and other datasets from Tuvalu to reveal the impact of industrial vessels on the willingness of artisanal fishers to go fishing. This revealed preference technique is a new approach to the problem of interactions between the two important sub-sectors of the tuna fishery.
Broadly, this paper considers three aspects of the interaction between industrial and artisanal fishing: 
  1. Does the presence or absence of industrial fishing vessels in the port of Funafuti affect a fisher's willingness to go fishing? 
  2. If so, what are the impacts on key livelihood indicators such as employment, income and the availability of locally produced fish? 
  3. To fully understand the trade-offs facing decision-makers we estimate the benefits of allowing transhipping in port and compare these to the modelled impacts in the artisanal fishery.
Discussion
There is no doubt that the presence of a transhipping port brings significant benefits to the economy and people of Tuvalu. Equally, however, the results presented here suggest some very serious negative impacts on the artisanal fishing sector. Fig. 5 presents a summary of the findings. Policy-makers will need to balance the trade-offs associated with the two fishing subsectors to ensure an optimal solution that maximises the benefits and minimises the costs.
The analysis indicated substantial reductions in fresh fish availability, with the loss in the artisanal fishery of more than 150mt in 2015. The fresh fish off-loads represented only 1% of Tuvalu's total estimated demand for fish [6] and where less than 10% of the catch forgone by artisanal fishers. However, it is important to place these figures into context. Total fish production in Funafuti was estimated by Tuvalu's Ministry of Fisheries and Economic Development [40] to be 285mt/year. Therefore, over a period of four years, this analysis suggests that Funafuti lost the equivalent of one year's catch due to the presence of industrial vessels, which discouraged activity by small-scale fishers. This could no doubt have significant impacts on peoples’ diets and access to good proteins. However, Bell et al. [6] provides an assessment of current fish production and its ability to sustain Pacific island populations, they report no current or projected deficit in fish production in Tuvalu. The data suggesting that current production just about meets the expected demand and therefore at an aggregate level
Tuvalu can effectively feed its people. Therefore the impact on fresh fish availability may be less significant than these contrasting figures initially suggest. We do not, however, have any data on food distribution, and it may be that the portion of the population who rely on artisanal fishers for fresh food fish are not those who can access the offloads from the vessels. This would benefit from further research but in the interim, the government needs to consider if redistribution policies maybe needed to ensure that all people have access to sufficient amounts of high quality fresh fish to meet their nutritional requirements.
Excluding fishing access fees, we estimate that the total income to government, individuals and businesses from transhipping was AUD 4.2 million or 12% of Tuvalu's 2016 GDP. This is in line with the extensive investigation of the benefits associated with other transhipping ports undertaken by McCoy [41]. Transhipment fees alone are three to four times higher than the loss of income in the artisanal fishery. However, revenue from fees is captured by the government and not the artisanal fishers and therefore do not directly offset the estimated income loss to artisanal fishers. On the other hand revenue from fees is used by the government to pay local staff salaries and provide public services that benefit all Tuvaluans. Further, fees can provide a valuable source of foreign exchange to the government. So whilst the artisanal fishers may suffer Tuvaluan society as a whole benefits.
About AUD 0.75 million of the AUD 4.2 million income is accrued to local bars and restaurants. (not that there are many there) The equivalent to the loss of income in the artisanal fishery is, therefore, captured by private businesses and individuals outside the fishery sector. This amount of money injected into the local economy from — what is effectively industrial tourism — is likely to have powerful multiplier effects and secondary impacts and, therefore, the total economic benefit is likely to be far larger than the immediate monetary spending of the crews. However, as with the government revenue, it is unlikely that this revenue is captured by theartisanal fishers who actually face a loss of income as a result of industrial vessels in port. Further, governments play a key role in redistributing revenues compared to private enterprises whose revenues are generally spread more narrowly. This can reduce economic disruption from increasing private incomes, especially when businesses are foreign owned [42]. The reduced income of artisanal fishers associated with transshipping is not directly offset by the benefits captured from the vessels. Clearly there is a distributional issue because those in the artisanal fishery are not the ones who capture the gains from transhipping. Therefore, the government could consider a transfer mechanism or support the artisanal fishing industry. Perhaps some hypothecation of transhipping charges could occur to support programmes such as the Tuvalu nearshore fish aggregation device programme, thereby making it easier and potentially more cost-effective for artisanal fishers to catch oceanic species [43,44]. Other programmes to support the artisanal fishing sub-sector could be considered such as providing ice, freezers or safety equipment, which would make easier and safer for fishers to fish for oceanic species and benefit from the government revenues from transhipping. 

Yet, the provision of equipment and infrastructure has been tried in the region (and Tuvalu) and the world many times, and by a variety of reasons, it never seems to work... I believe the key reason is the lack of incentives arising from the ownership of the provided goods

The loss of FTE days in the artisanal fishing sector is offset three times or more by the estimated employment created in the transshipping sector for the Funafuti population. However, as with the changes in fresh fish and income artisanal fishers are unlikely to be the ones employed during transhipping. So whilst leading to an improvement in overall welfare, the improvement is not Pareto efficient. Béné et al. [45] demonstrate that return on investment in a small-scale fishery is more than 100 times greater than that from industrial vessels in terms of cost of each job created. With this in mind, a three-to-one replacement ratio  is far from efficient. When considering appropriate support to each subsector, decision-makers must consider which sector offers the best return on investment for the policy objective that they are pursuing and be aware of associated trade-offs as the harder to observe negative impacts may outweigh the benefits.
Transhipping in port, under the authority of a country government, means that the country can confirm vessels that are fishing legally, cross-check logsheet records with observed transhipments, and ensure that the vessel is in full compliance with all marine and fishery regulations.
These wider benefits have not been quantified in this paper, but nevertheless are likely to be of benefit regionally and thus represent a global or regional public good. McCoy [41] estimated that these benefits range from USD 1000 to USD 8000 (AUD 1200 to AUD 9600) per transhipment, depending on the port, but did not include Funafuti in his analysis.
The social costs associated with industrial fishing are well established, including social cohesion, prostitution, unwanted pregnancy, smuggling, illegal entry, substance abuse and general poor behavior [46–48]. The survey of the local establishments, however, was not as negative as the literature, and only one establishment had banned crews from entering, and only a quarter of the establishments suggested that they had issues with the crews, this was generally as a result of intoxication of the crew. Nevertheless, the social impacts should be important considerations for countries considering developing transshipping ports.
Artisanal fishing vessels have a number of environmental impacts however are generally more fuel-efficient and generate less waste than their industrial counterparts [49]. The environmental costs associated with transhipping include oil and fuel spillages, marine litter and toilet and hold flushes into the Funafuti lagoon [50]. An evaluation of these impacts, however, is extremely complex and has not yet been attempted.
A number of environmental violations have occurred in recent years in Funafuti (Tuvalu Fisheries Department, pers com); therefore, the government must balance the higher environmental risk associated with transhipping compared to artisanal fishing with the benefits that it brings to Tuvalu and its people.
This work provides Tuvalu and other countries that have transshipping ports with information that could allow them to optimise the benefits from being a transhipping port by minimising the losses. Many governments have already attempted to do this by managing bycatch and using some for local food security purposes. As the marginal losses to the artisanal fishery decrease with more vessels being present in port, it is suggested that some coordination of vessels transhipping would be helpful. It would also be advisable to avoid transhipping when artisanal catches are likely to be higher. This could be done by declaring certain times ‘non-port’ days for all transhipping vessels, particularly on peak artisanal fishing days such as Friday. The artisanal data show that landings are generally lower, on average, on the weekend; therefore, Sunday could be a good day to tranship because there is little or no artisanal fishing activity that day. Although each port considering this as an option to limit the impacts of the transhipping fleet on the artisanal fleet would need to carefully investigate the commercial and operational viability of such an option.
Conclusion
This paper confirms, for the first time, the existence of indirect economic interactions between industrial fishing vessels and artisanal fishing vessels. These results are in direct contrast to the requirements under the UN Fish Stocks Agreement to avoid the adverse impacts of industrial fishing on small-scale fishers. The study location, Tuvalu, provided a unique dataset to allow this study. The results should be carefully considered by all country governments that allow, or are planning to allow, transhipping in their ports, particularly those countries with a large artisanal fleet based near or at the main port.The analysis demonstrates that transhipping has a negative impact on Funafuti's artisanal fishers in terms of reduced income, employment and catch rates. The results also show it reduces the availability of locally-produced fish in Funafuti. However, it is also clear that transshipping brings economic benefits to Funafuti and the local people.The analysis contrasted the losses within the artisanal fishery with the benefits of transhipping and found that some of the losses were at least partially offset but only at a societal level. It showed that it was likely that a Pareto loss was present as benefits from transhipping do not fall on those whom face the losses. Policy-makers need to strike a balance between the competing demands of the two sub-sectors to ensure Pacific communities can capture the maximum net benefits from the massive tuna resources present in their exclusive economic zones.

I could bring a different perspective to some of the assumptions and conclusion in the paper, but I totally welcome the approach and methodology it provides. A lot of everyone work is focussed on the fisheries status, policy, management, revenue and MCS. But one of the lines I always use in my work and job interviews is "I don't work with fish, I work with the people that work and depend on fish". Alex, Philip and Loto's work to focus on that, and we should be doing more research in that area.

Transhipment port blues

Transhipment port blues

The environmental niche of cheap longlining in the high seas by Francisco Blaha

And the IAS dataset papers just keep coming, and here one that that put focus on High Seas longliners activities and bring all sets of well grounded reasons on how and why they operate there. As the cheap shot I am, I share my colleague Tim Adams opinion: is the refuge for the cheap operators. There is no license to pay to fish on the high seas, their flag state pays their contributions to the RFMOs and they provide high seas permits like if they are free candies. That is motivation enough to hang out there.

2013-04-03 17.04.01.jpg

I find the graphs showing the concentration of the longline effort on the edges of the Pacific Islands Countries EEZ's, where they fish without paying anything, really upsetting but that is the reality, and that "transparency" is perhaps the biggest contribution of all these IAS based papers. (I also find upsetting that they cat the Pacific in half and all these fisheries maps are "Atlantic centric", but that is a different topic

Anyway, as usual, read the paper "The environmental niche of the global high seas pelagic longline fleet" and draw your own conclusions, I quote below some of the parts I like.

Abstract
International interest in the protection and sustainable use of high seas biodiversity has grown in recent years. There is an opportunity for new technologies to enable improvements in management of these areas beyond national jurisdiction. We explore the spatial ecology and drivers of the global distribution of the high seas longline fishing fleet by creating predictive models of the distribution of fishing effort from newly available automatic identification system (AIS) data. Our results show how longline fishing effort can be predicted using environmental variables, many related to the expected distribution of the species targeted by longliners. We also find that the longline fleet has seasonal environmental preferences (for example, increased importance of cooler surface waters during boreal summer) and may only be using 38 to 64% of the available environmentally suitable fishing habitat. Possible explanations include misclassification of fishing effort, incomplete AIS coverage, or how potential range contractions of pelagic species may have reduced the abundance of fishing habitats in the open ocean.

Results

High seas longline fleet composition and distribution
After analyzing all satellite-based AIS fishing effort data from GFW, we found that longline fishing effort in the high seas accounted for 84 to 87% of the fishing effort (by hour) across gears during the study period (fig. S1). While longline fishing effort is lower in ABNJ, it represents a major top-down pressure on oceanic ecosystems (27). Of the high seas longline fishing effort, 88.9% (2015) and 80.4% (2016) were attributable to five fishing States or territories: China, Japan, South Korea, Spain, and Taiwan (fig. S2). Taiwan dominates global longline fishing effort (by hour) in the high seas, followed by Japan, Spain, China, and South Korea. Our analysis focuses on these top-five fishing States or territories. AIS-derived fishing effort data show that the distribution of longline fishing effort in the high seas changes across space (Fig. 1) and time (Fig. 2). During 2015 and 2016, the tropical (23.5°N to −23.5°S) and temperate (66.5°N to 24.5°N and −24.5°S to −66.5°S) regions contained 64.6 and 35.3% of the global fishing effort, respectively. On average, the intensity of fishing effort in the high seas is higher during the boreal summers and peaks in July and August during 2015 and 2016, respectively (Fig. 2). The overall increase in fishing effort data between years is likely driven by an increase in the number of orbiting satellites capable of detecting AIS signals, as well as an increase in the capability of detecting and classifying longline fishing effort by the GFW group. Despite the increase in fishing effort intensity, the seasonal pattern where global longline fishing effort increases during the boreal summer months seems to be preserved between the two years. Untangling the drivers of the observed seasonal patterns of fishing effort requires a regional, fleet-specific approach that includes information about target species, fishing seasons, and quotas. All fishing effort data needed to evaluate the conclusions in this paper are available from GFW.

Fig. 1 Distribution of global pelagic drifting longline fishing in ABNJ in 2015 and 2016. (A) 2015. (B) 2016. Light gray areas depict exclusive economic zones (EEZs) that were excluded from this study.

Fig. 1 Distribution of global pelagic drifting longline fishing in ABNJ in 2015 and 2016. (A) 2015. (B) 2016. Light gray areas depict exclusive economic zones (EEZs) that were excluded from this study.

Monthly persistence maps provide a visual representation of the global changes of fishing habitat suitability throughout the year (Figs. 3 and 4) and help identify areas of the high seas where favorable environmental conditions for longline fishing are most stable. The monthly persistence maps also help identify areas of the high seas that are not classified as environmentally suitable for longline fishing throughout the year, which provides valuable information about which areas may be experiencing less longline fishing pressure.

F4.large.jpg

CONCLUSIONS
As we combine an improved understanding of open-ocean fleet behavior with knowledge of the drivers of distribution of target and nontarget marine taxa, our ability to predict the co-occurrence of fishing with sensitive species or ecosystems will improve, as will the efficacy of related management measures. As the intensity and overlap of human uses of ABNJ continue to grow, ocean governance structures will have to rely more heavily on different forms of dynamic spatial management to accommodate all users and activities, which, in turn, rely on open-access remote sensing data and collaborations between researchers, fishers, and the management community Our research demonstrates how the global pelagic longline fleet exhibits predictable environmental preferences for various biophysical and physiographic predictors, which can be used to explore the current and future distributions of fishing fleets. Improvements in remote sensing and oceanographic forecasting for variables (for example, SST) open new opportunities for the implementation of adaptable ocean management measures that match the dynamics and distributions of ocean biological resources and resource users. As we grapple with rapidly changing oceans and ocean uses, advancements in predictive modeling, aided by new technologies, will help us move away from reliance on retrospective tactics in area-based management and toward more dynamic approaches capable of delivering ecosystem-based management.


The rise of the DWFN by Francisco Blaha

Among the plethora of papers coming out of via the IAS dataset and some clever data analysis, here is another one that shows and set numbers to things we suspect. This is on a analisys on the activities of the main Distant Water Fishing Nations (DWFN). So, I make it short and sweet (and say a bit about an issue I have with the methodology)

yeah... we fishing here but the money goes that way

yeah... we fishing here but the money goes that way

Of course read the original: Far from home: Distance patterns of global fishing fleets, and make your own conclusions.

The abstract 
Postwar growth of industrial fisheries catch to its peak in 1996 was driven by increasing fleet capacity and geographical expansion. An investigation of the latter, using spatially allocated reconstructed catch data to quantify “mean distance to fishing grounds” found global trends to be dominated by the expansion histories of a small number of distant-water fishing countries.

While most countries fished largely in local waters, Taiwan, South Korea, Spain, and China rapidly increased their mean distance to fishing grounds by 2000 to 4000 km between 1950 and 2014. Others, including Japan and the former USSR, expanded in the postwar decades but then retrenched from the mid-1970s, as access to other countries waters became increasingly restricted with the advent of exclusive economic zones formalized in the 1982 United Nations Convention on the Law of the Sea.

Since 1950, heavily subsidized fleets have increased the total fished area from 60% to more than 90% of the world’s oceans, doubling the average distance travelled from home ports but catching only one-third of the historical amount per kilometre travelled. Catch per unit area has declined by 22% since the mid-1990s, as fleets approach the limits of geographical expansion. Allowing these trends to continue threatens the bioeconomic sustainability of fisheries globally

Results
Analysis of the mean distance travelled by the industrial fleets of the world’s 20 largest fishing countries between their home countries and the locations where catches were taken illustrates three distinct patterns: rapid and largely continuous expansion (Fig. 1A), early expansion followed by stabilization or retrenchment (Fig. 1B), and limited or no expansion (Fig. 1C). The fishing fleets of Taiwan, South Korea, Spain, and China have continuously expanded their mean distance to fishing grounds by at least 2000 km since the 1950s, with the first three of these now fishing, on average, more than 3000 km from their home ports (Fig. 1A).

These are globally operating distant-water fleets and flag states, accounting for nearly 20% of the global industrial catch over the last decade (Fig. 1A). Spain was already fishing, on average, nearly 1500 km from home at the start of global data records in 1950 (Fig. 1A), largely driven by the country’s long history of fishing for Atlantic cod off the Canadian east coast. Five countries or former countries that currently account for about 27% of global industrial catches showed expansion during the early postwar decades but appear to have curtailed or consolidated their distant-water operations since then (Fig. 1B). This includes the former USSR, which had a large distant-water fleet during the 1950s and 1960s, operating, on average, more than 2000 km from home. In scale and early timing of expansion, the former USSR is only exceeded by Spain, South Korea, and Japan (Fig. 1, A and B).

However, while Spain and South Korea have continued a fairly monotonic expansion, the countries of the former USSR began to retrench in the 1970s. Japan, after rapid postwar industrial expansion, also consolidated its fishing effort within the Indo-Pacific region starting in the 1970s (Fig. 1B). The remaining 11 of the 20 largest fishing countries, accounting for 33% of global industrial catches, have shown little or no expansionist efforts over the last 65 years (Fig. 1C).

Fig. 1 Trends in the distance traveled to fish from 1950 to 2014.

Fig. 1 Trends in the distance traveled to fish from 1950 to 2014.

Norway has begun to fish relatively further afield in recent years, likely driven by the rapid growth in contribution of its Antarctic krill (Euphausia superba) fishery from<1% of the national total catch in 2006 to 7% in 2014 (www.seaaroundus.org). For the top 20 fishing countries, catches caught on the high seas or in the EEZs of other countries grew by more than 600% between1950 and 2014, increasing their contribution to global catches from16 to 23% over this period (www.seaaroundus.org). Catches by distant-water or“foreign” vessels have therefore grown faster than catches by countries within their own waters, illustrating the increasing importanceof distant-water fishing among the countries that supply most of the world's wild-caught seafood.

Driven strongly by the trends in fishing distance among the 20 largest fishing countries, the net effect since 1950 is a global doubling of the mean distance fished from port (fig. S1). However, this net expansion has been associated with a strong decline in the catch obtained per kilometre travelled over the 65-year time period. Catches declined from more than 25 metric tons per 1000 km travelled in the early 1950s to approximately 7 metric tons per 1000 km travelled by 2014 (Fig. 2).

The global industrial fishing catch increased fivefold between 1950 and its peak of 100 million metric tons in 1996 but has declined steadily by around 18% over the two decades since (Fig. 3A). In contrast, the percentage of total ice-free ocean area used for industrial fishing increased rapidly from 60 to 90% during the 1950s and 1960s, plateaued through the mid-1990s, and has expanded by less than 5% in the last two decades (Fig. 3B). The combination of these two patterns suggests that industrial catch per unit area of ocean fished expanded through peak catch in 1996 but has since declined by 22% (Fig. 3C)

Fig. 4 Spatial mapping of the distribution and intensity of industrial fishing catch. Mean industrial fisheries catch in metric tons per square kilometer by catch location during the (A) 1950s and (B) 2000s.

Fig. 4 Spatial mapping of the distribution and intensity of industrial fishing catch. Mean industrial fisheries catch in metric tons per square kilometer by catch location during the (A) 1950s and (B) 2000s.

--- 

I find very illustrating graph 1 as it represent what I have seen worldwide, and I like the sentiment of the paper. Yet, the author's headline-grabbing line stated that the total fished at the present is more than 90% of the world’s oceans. But that's only if you count one catch in every 1/2° × 1/2° latitude and longitude cell as "fished" (That is 51km x51km). So, the smaller the grid (cells) the less of the ocean is fished. If each cell is 1 ocean, 100% has been fished, if is cell is a 1cmx1cm most would be unfished?

Furthermore, a lot of transit and drifting happens, which is not fishing. When I analyse VMS tracks you see that there is a lot of ocean navigated but not fished.

Maybe "90% of the oceans have been navigated by FV when we divide the oceans in 51x51 km grid cell be more accurate, but them... surely less headline-grabbing.

High seas fisheries play a negligible role in addressing global food security by Francisco Blaha

A lot is written at the moment of the High Seas (or Areas Beyond National Jurisdiction – ABNJ), form various angles. A lot of the press portrait it as an unprotected and lawless place, but as my friend, Mercedes Rosello recently (and graciously) wrote: "There *are* protections! Yes, they are limited and imperfect. That means that they need to be complemented, reinforced, implemented, and enforced. *Ignoring* them is not the way forward!.

Not as much as they make you believe

Not as much as they make you believe

The high seas Is a deserved area of interest, (I often write about what is happening there). A question that is not regularly evaluated is why people go fishing there? Is not close and accessible, but not utterly lawless as I recently read.

Is there so much fish there that the DWFN need to operate there to survive? Or is geopolitics? Or is just that are working in areas adjacent sometimes and it does not cost much to get there… in fact, they don't have to pay licenses to be there to anyone, not even to RFMOs. So there is a lot of questions that are there and are being answered, mostly by academics that have the time and funds to do it! I only have a lot of questions and a lot of work… so tough luck for me in finding the time to work on that!

In any case, a card that has been played by the DWFN is that the catches in the High Seas are a vital part of food security. 

Yet my “friends in fish” Laurenne Schiller and Megan Bailey (I recently loved another publication by them involving Dr Seuss) with other 2 authors, got into that assertion and very originally (just because they are clever and original people) titled their latest paper (published yesterday) with the conclusion of their work: “High seas fisheries play a negligible role in addressing global food security”

And yes, their paper deals precisely with that, it proves that the food security argument is just not substantiated by data or facts. As usual, I recommend you read the original, I just quote some of the parts I found more interesting.

Abstract
We analysed high seas catches and trade data to determine the contribution of the high seas catch to global seafood production, the main species caught on the high seas, and the primary markets where these species are sold. By volume, the total catch from the high seas accounts for 4.2% of annual marine capture fisheries production and 2.4% of total seafood production, including freshwater fisheries and aquaculture. Thirty-nine fish and invertebrate species account for 99.5% of the high seas targeted catch, but only one species, Antarctic toothfish, is caught exclusively on the high seas. The remaining catch, which is caught both on the high seas and in national jurisdictions, is made up primarily of tunas, billfishes, small pelagic fishes, pelagic squids, toothfish, and krill. Most high seas species are destined for upscale food and supplement markets in developed, food-secure countries, such as Japan, the European Union, and the United States, suggesting that, in aggregate, high seas fisheries play a negligible role in ensuring global food security.

To assess the contribution of the high seas catch to global food security, we determined (i) the contribution of the high seas catch relative to other sectors of seafood production, (ii) the main high seas fishing countries, (iii) the species composition of the high seas catch, and (iv) the primary importing countries and associated markets for those species. We used annual catch statistics from the Sea Around Us reconstructed fisheries database (v. 47), aquaculture and freshwater production estimates from the UN and Food and Agriculture Organization (FAO) (4), and import and export data from the FAO FishStat database (v. 3.01).

Fig 1:&nbsp;Average contribution (million metric tons) of seafood-producing sectors, 2009–2014

Fig 1: Average contribution (million metric tons) of seafood-producing sectors, 2009–2014

High seas catch by volume
Between 2009 and 2014, the total landed catch on the high seas was an average of 4.32 million metric tons annually. This volume represents 4.2% of the annual marine catch (102 million metric tons) and 2.4% of all seafood production, including freshwater fisheries and aquaculture (178 million metric tons; Fig. 1

High seas catch by species
Thirty-nine fish and invertebrate species accounted for 99.5% of the high seas catch identifiable to the species level during the time period sampled. Only one of those species, Antarctic toothfish, was caught exclusively on the high seas (3700 metric tons annually) and represented 0.11% of the total high seas catch. The remaining species are “straddling” and/or highly migratory species (that is, caught both on the high seas and within EEZs). The top three species caught on the high seas were all tunas: skipjack (967,000 metric tons annually), yellowfin (563,000 metric tons annually), and bigeye (336,000 metric tons annually). The tunas (these species plus albacore and the three bluefins) collectively accounted for 61% of the total high seas catch by volume. Other main species groups were non-tuna pelagic fishes (26%), pelagic squids (7%), billfishes (3%), demersal fishes and invertebrates (2%), and krill (1%)

High seas catch by producers and consumers
Ten fishing countries were responsible for 72% of the total high seas catch between 2002 and 2011. China and Taiwan alone accounted for one-third of the world’s total high seas catch, while Chile and Indonesia had the third and fourth largest catches, followed by Spain. Despite having the largest high seas catch by volume, fish from the high seas account for only 5% of China’s total domestic catch. Catch from the high seas contributed to ≤6% of the total national catch for half of the top 10 fleets: China, Japan, India, Indonesia, and the Philippines; only for Ecuador and Taiwan did high seas catches account for more than one-third of their domestic landings.

Current traceability standards do not allow disaggregation of imported seafood into spatial jurisdictions (that is, caught on the high seas versus in an EEZ). However, imports of species caught on the high seas are available, and Japan was the top importer of all three globally traded bluefins (93% for southern, 58% for Atlantic and Pacific), as well as bigeye (75%), and the secondary importer of yellowfin (20%) and both toothfishes (22%). Thailand was the top importer of skipjack (63%), yellowfin (21%), and albacore (30%), and Spain was the secondary importer of albacore (19%). The United States imported the majority of both toothfishes (48%) and all of the krill and was the secondary importer of southern bluefin (2%). With the exception of South Korea importing almost all of the globally exported chub mackerel and Pacific saury, all other primary importers of species caught on the high seas were from the European Union (EU) (for example, Denmark, France, Italy, Spain, and the Netherlands). Further details of these trade flows—and additional trade of affiliated processed products—are available in Fig. 2 

Fig. 2 Imports of species caught on the high seas.Solid arrow width proportional to destination’s share of total global imports for each species group (fresh, frozen, unprocessed form), and dashed arrows indicate likely form of consumption in primar…

Fig. 2 Imports of species caught on the high seas.

Solid arrow width proportional to destination’s share of total global imports for each species group (fresh, frozen, unprocessed form), and dashed arrows indicate likely form of consumption in primary importing country or, if applicable, processed product produced.

High seas fisheries contribute an estimated 4.3 million metric tons (2.4%) to the global seafood supply. In 2014, these fisheries were valued $7.6 billion, yet they are enabled by an estimated $4.2 billion in annual government subsidies (17).

Conclusions
The discussion of access to the high seas will inevitably lead to concerns about how closing areas to fishing could affect global food security. Here, we show that only one species of toothfish is caught exclusively on the high seas, that the high seas catch contributes less than 3% to the global seafood supply, and the vast majority of the marine life caught on the high seas is destined for upscale markets in food-secure countries. On the basis of the available data, high seas fisheries do not make a direct or crucial contribution to global food security.

----

I really like Megan and Laurenne's approach to a lot of their research, and hope to see more of them coming out (and hopefully participate on some).

Bunkering at sea, IUU Fishing and Social Network Analysis by Francisco Blaha

I remember as a kid learning maths and by some reason was fascinated by the concept of “common factor” and while this new paper does not deal with that concept itself, it did make sense to my little brain to see it from that perspective.

Not really a bunker... but you get the idea.

Not really a bunker... but you get the idea.

The biggest “conditioning factor" for the time a fishing vessel can fish is fuel. Even if efficiency has moved forwards a lot, there are substantial fuel users… According to an ISSF-commissioned study, the longliners burns roughly 1,070 litres of fuel to land one ton of tuna (in comparison a Purse Seiner burns 368 for the volume, but catches way more per set)

Furthermore, the bigger your fuel thanks the smaller the space for your fish (and at least if the vessels is EU approved, cannot use fish holds as fuel thanks as most vessels actually do), hence (as anything in fisheries) is all about compromises.

If vessels had to come back to port to refuel every time they run out, fishing as we know it would not exist (may be a good thing). In any case, the dependence of vessels to stay at sea for more than their autonomy based on the capacity of their fuel thanks is ONLY via bunkering (the supplying of fuel for use by ships) and this is a world on itself. A world many many people in fisheries (including me) don't really know a lot about. The ones I was involved always were a decision in between the skipper, the vessel manager on one side, and the captain of the bunker and its owners on the other. 

Bunkering it's a rather complex manoeuvring highly dependent on weather, ocean conditions and the respective sizes of both ships, the simplest scenario is illustrated here. But I can’t remember any of the ones I been involved with that dint involve at least some fuel spill... but that is another topic i like to study one day

Bunkering, is also solid business and there are big companies that deal with entire fleets and some smaller ones that are less transparent. Some, like this company, publish where their bunkers are in the Pacific and the world.

As transhipments in at sea, bunkering is regulated, but… While in principle all bunker need to be registered in the WCPFC record of fishing vessels, and then licensed to operate in the countries EEZ, and they have to be reported… not always the system is being followed.

And of course in the High Seas is the responsibility of the flag states, and as you imagine... bunkers tend to be flagged in developing countries with open registries and weak oversight. In fact, bunkers are as necessary to fishing as carriers, which at least tend to have an observer on board, as a fishing support vessel, something way more diffuse in bunkers.

I always had the idea that if were to investigate better the “common factors” approach in port agents, bunkers logistics, and captain networks / afficliations we could get a better understanding of the inside dynamics of the Pacific longlining fleet that is where we have the biggest impact of IUU in the region. But as one band man, not much chance to do research for the love of it and work as a consultant under well defined ToRs... so i keep those ideas packed in my brain and maybe one day i get paid the develop then!

And voila, here is a paper “Chasing the Fish Oil—Do Bunker Vessels Hold the Key to Fisheries Crime Networks?  that deals with that issues, yet it uses social network analysis (SNA) a more sophisticated approach that my basic “common factor” idea, and coincidentally I got to meet Jessica Helen Ford (the main author) a few weeks ago in Bangkok

Interestingly her background is not fisheries, but statistics and organisms movement, so she brings a totally fresh approach to this field… and I just love that, because it challenges you to think differently. Besides been VERY clever she is also really nice and a cool person. So I’m sure I will keep following her work. 

As usual, I recommend you read the original she wrote with other two colleagues from CSIRO in Australia, I just quote some of the things I found more interesting.

Abstract
Disentangling fleet activities, therefore, necessitates identifying and understanding how key players or actors function to support or guide IUU activities. In this regard, recent efforts have focused on identifying transshipment activities by finding and following refrigerated cargo (reefer) vessels. We suggest that bunker, or fuel vessels, may provide one solution to understanding and unravelling these IUU networks for two main reasons: they are fewer in number, are known to provide additional support to fishing vessels beyond refuelling. In this respect, bunker vessels are also used to resupply provisions, and crew, thereby facilitating human trafficking and slavery, which is demonstrably rife in certain components of the commercial fishing realm (e.g., long distance or high seas fleets). Here, we illustrate how social network analysis (SNA) could be used as a methodological lens to expose previously clandestine IUU fishing fleet dynamics. Specifically, we highlight the connectedness of a tanker vessel, and several fishing and reefer vessels, in an area in the Southern Indian Ocean that has high levels of fishing and general shipping.

Crime and Social Networks
A considerable amount of literature in criminology and social psychology illustrates the important role that socialization and the surrounding environment play in shaping people's behaviours. While an extensive literature review is beyond the scope of this current project, a key finding from these research domains is that people's behaviors are shaped by their social and natural environment and the people with whom they associate (e.g., Bandura and Walters, 1977Gordon et al., 2004Akers, 2009). Understanding the dynamics and mechanisms of information transfer in the social systems or networks that these criminals operate in is therefore vital and can be accomplished with social network analysis (SNA). Broadly, SNA aims to describe and explain the structural patterns and mechanisms that define social relationships between humans (Scott, 2017).

In brief, SNA shows how individuals are joined in a population using various metrics. These range from degree centrality, which counts the connectedness of a node given the number of connections, to more complex metrics such as eigenvector centrality, in which a node's importance is proportional to the centrality score of all its connections (for more information see Mbaru and Barnes, 2017).

Social network analysis has previously been used to understand natural resource governance (e.g., Bodin and Crona, 2009), including fisheries-related topics such as the success of co-management arrangements (Sandström et al., 2014Alexander et al., 2015), willingness of fishers to enforce sea tenure (Stevens et al., 2015), information diffusion among resource users (Pietri et al., 2009Mbaru and Barnes, 2017), and recently, to tie fishing practices to ecosystem health (Barnes et al., 2016).

Fuel resupply vessels (bunkers) have been acknowledged as an integral component of the infrastructure needed to maintain IUU fishing (Gianni and Simpson, 2005). However, we propose that the importance of bunker vessels has been underplayed to date, and increased effort should be focused on tracking and monitoring them. In comparison to reefer (refrigerated cargo) vessels, bunker vessels (although fewer in number) are likely more connected than reefer vessels. We propose that tracking their paths and movements should indicate zones of both legal and potential illegal fishing activity.

Here, we apply SNA to illustrate the dynamics, network position, and importance of bunker vessels in a fleet. Social network analysis is a valuable but seemingly unused tool for this type of investigation; it can provide a framework to infer associations and describe a social structure (Farine and Whitehead, 2015), in some cases allowing inference about vessels based on their associates and connections. We demonstrate how it can be applied to fishery fleet dynamics to understand the nature of the connections and the key players in a network.

An Example of Social Network Analysis
We examined social networks of vessels in a region of the southern Indian Ocean (bounded by Latitude S 25°-S 35° and Longitude E 80°-E 110°) characterized by extensive fishing activity and major shipping lanes transiting to and from Australia. We used 6 months of AIS data, from May to October 2016, in order to demonstrate our application of the methods discussed here. Automatic Identification System was originally developed and implemented for safety as an anti-collision tool and is mandated for all vessels 300GT and over, on international voyages, and all commercial passenger ships (International Maritime Organisation, 1974). There were 181 unique vessels with more than 100 registered AIS transmissions in the region, which included: 119 bulk/container/vehicle carriers, 45 fishing vessels, 11 oil/chemical/liquefied petroleum gas tankers, 4 reefers, and 2 research vessels.

We used iGraph package (Csardi and Nepusz, 2006) in R (R Core Team, 2016) to model an undirected and unweighted network. We considered each of the 181 unique vessel Maritime Mobile Service Identity to be a vertex, and edges were calculated assuming proximity (within 10 km) to other vessels on a given day.

An important point to note here is that we were using movement to infer a social network, so proximity, or potential rendezvous, were assumed to represent interactions, which we were then able to map. In this sense, we were constructing a social network from surveillance data, not from interaction with the actors. There are potential benefits to such an approach, in that it may avoid respondent bias, but also some limitations as it is an indirect measure of the social network. We note that we have used a proximity measure here, and any changes in the assumed connection of nodes will cause variation in results. In addition, due to the purpose and focus of this article, we keep all reference to particular vessels or flag states anonymous.

Figure 1. Network plot of all 181 vessels in the region. Most central node is indicated by a red square, and most central fishing vessel by a blue square.

Figure 1. Network plot of all 181 vessels in the region. Most central node is indicated by a red square, and most central fishing vessel by a blue square.

The SNA of vessels in the southern Indian Ocean (Figure 1) indicates several key players, and results point to several potential sub-networks. Importantly, across several measures (each of degree centrality, closeness, and eigenvector centrality), a tanker (bunker) vessel was ranked highest for each measure, followed by two fishing vessels (registered longliners). Most importantly in this context is the measure of eigenvector centrality, which is a combined measure of a vessel's importance, and the importance of all its connections in the network. For this measure, the top three ranked vessels were a tanker and two fishing vessels (both longliners). Given all 181 vessels, fishing vessels placed 35 out of the top 40 vessels. The other five vessels in the top 40 were the tanker (1st) and four reefer vessels.

How Are Social Networks Useful for IUU Fishing?
Given our findings that tanker vessels are central in a network of fishing vessels, we propose that they may serve as a useful indicator of fishing vessel activity. This is particularly relevant as fishing vessels are not required to transmit AIS (International Maritime Organisation, 1974), and often when operating outside the control of a Regional Fisheries Management Organisation or national government, they may not carry a vessel monitoring system, and so are effectively unmonitored. While surveillance data, such as satellite radar, may still identify them, this data is limited in availability and generally quite expensive. By contrast, bunkering and refrigerated cargo vessels are required to transmit AIS, and thus are more readily tracked (Metcalfe et al., 2018). However, it is important to note that there is the possibility for all vessels to switch off their AIS (Tetreault, 2005) and thus go unmonitored.

Figure 2. Tracks of four supply vessels noted to have had irregular behaviors. Gray dashed lines indicate extent of data for purposes of presentation. Inset box displays extent of data in larger region.

Figure 2. Tracks of four supply vessels noted to have had irregular behaviors. Gray dashed lines indicate extent of data for purposes of presentation. Inset box displays extent of data in larger region.

We show tracks of several support vessels (Figure 2), including bunkering and refrigerated cargo vessels, traversing the region between Papua New Guinea, Indonesia, Timor Leste, and Australia. Of note are the positions of these vessels off of the south coast of Timor Leste. These support vessels remained in this region for extended periods of time, despite the lack of any relevant infrastructure, and returned on numerous occasions. Sometime well after the authors initially noted this behavior, subsequent reports emerged that several large factory trawlers from China were operating in Timor Leste waters (IUUWatch, 2017). Although we are not aware of any actual link, we propose that this example is a key illustration for linking illegal networks with observed activities in an area—the irregular behavior of the bunker vessels was evident well before any knowledge of illegal fishing activity in the area.

Summary
Social networks have been used to study ecological interactions for varying populations. The application of SNA above demonstrates the applicability of the use of social networks in understanding and assisting in maritime domain awareness, and specifically as it is applied to fisheries monitoring.

A key advantage of such an approach is that the network highlights the key conduits of information. In the example we provided, a bunker vessel and several fishing vessels were frequently ranked at the top, regardless of which measure of centrality was used. This effectively highlights the importance of tracking supply vessels to uncover potential IUU activities. As previously noted, most of the focus to date has been on the role of reefer vessels in facilitating IUU activity (predominantly through transshipment). However, we propose that bunker vessels, which classify as support vessels and thus fall within the definition of IUU, are an important conduit within the IUU network.

The role of bunkers as a key conduit of information positions them to potentially hold information about illegal networks. It is also possible that bunker vessels, in their role of transshipment of provisions and crew, thereby facilitate human trafficking (Ewell et al., 2017). As such, resupply vessels are either knowingly, or inadvertently, supporting conditions conducive to slavery. Previous research has highlighted the role that insurance companies could play in combatting IUU fishing (i.e., withholding insurance for vessels known to engage in IUU, see Miller et al., 2016 and Soyer et al., 2017), an approach that may also be conducive to curtailing the role of supply vessels deemed to support IUU fishing activities.

----

As I wrote before, I totally welcome these type of papers. Yes, I know, there are limitations in the use of IAS for MCS. But the genie is out of the lamp, and while IAS is not new, only recently we had the computing capacity and funds available to tackle the mammoth task of analysing such vast amounts of data and mixing it with fresh approaches. And the effect is profoundly disrupting, even is just by bringing prior impossible transparency, new people and their differeent approach to intelligence into this area. 


FAD numbers and their tracking in the WCPO by Francisco Blaha

I never been to the meetings of the Science Committee of the WCPFC (the 14th one is happening in Busan, Korea at the present) yet I try to make time to read the papers presented (mostly by SPC) as they present the latest understanding of an incredible variety of aspects associated to the management of the world’s biggest fishery.

While by academic training I’m a fisheries biologist, after my thesis (identification of new reproductive stock of hake) I barely did anything related to stock assessments or the wider applied science field, as went back into fishing and operational work. Yet I get a kick from pushing myself to stay updated. 

Dont blame the tech... blame their missuse

Dont blame the tech... blame their missuse

Some of the papers are really dense reading and for the connoisseurs only, but most can be followed if you have a keen interest and know the basics… in any case one of my favourite topics if the one on FADs (and been writing for a while about them), and among the paper of this session there are two that brought home the staggering numbers we are dealing with, the technological advances in them, the impact they are having on the fishery and the challenges around their management (or lack of).

My brilliant colleagues at SPC author the papers “Estimates of the number of FADs active and FAD deployments per vessel in the WCPO” and “Report on analyses of the 2016/2018 PNA FAD tracking programme”, and if you are interested in FADs are compulsory reading.

I quote below the parts that impacted me the most. And then at the end, for whatever is worth, I rant a bit on my ideas for their management.

The first paper (estimates of FAD numbers) attempts to estimate the number of deployments and active FADs per vessel. Estimates were derived using two different approaches. Firstly, based on fishery data for 2011–2017, the number of deployments recorded in the observer data, the observer coverage by vessel, and a clustering of vessels based on their FAD fishing strategy were used to estimate the total number of buoy (and FAD) deployments per vessel and total in the WCPO. The number of deployments varied from 0 to 500 per vessel but few vessels (depending on the estimation method and year) deployed/redeployed more than 350 buoys per year. This corresponds to a total estimated number of deployments between 21,000 and 51,000 per year in the WCPO for the 2011–2014, but the numbers drop thereafter, likely due to delays in receiving observer data for recent years. 

IMG_9641-Edit-1.jpg

The second approach combined fishery data and the PNA FAD tracking data and therefore only covered 2016 and 2017 with precise estimates only possible for some vessels. The estimated number of deployments per vessel varied between 1 and 550 (mean = 129) in 2016 and 1 and 999 (mean = 226) in 2017 and the estimated number of active FADs per vessel varied between 1 and 454 (mean = 102) in 2016 and 1 and 955 (mean = 163) in 2017. At the scale of the WCPO, this corresponds to 30,700–56,900 deployments in 2016 and 44,700–64,900 in 2017; and 26,200–37,300 active FADs in 2016 and 38,000–48,200 in 2017. The ratio between number of deployments/redeployments per year and number of active FADs per vessel and per year average at 1.48. Less than 16% of the vessels were estimated to have more than 350 active FADs per year.

Yet the sentence I’ll remember the most is “The total number of deployments varied between 30,700 and 56,900 in 2016 (based on average and quantile 95%) and 44,700 and 64,900 in 2017”. One could be inclined to think that with so many FADs there are actually no free schools… but just schools swimming in between FADs.

To improve the ability of the Scientific Committee to estimate potential FAD levels, the collection of additional information is suggested. For example, to better understand the total number of FADs in the water, this could include the submission of i) the number of new FADs deployed per year per vessel; ii) the average daily or total number of active FADs per vessel per month; and iii) the number of deactivated FADs per month. The first could be derived from fishery data, if observers can record all FAD deployments or if captains start recording these data in a FAD logsheet. In order to obtain an estimate of the average daily or total number of active FADs per vessel these data could be derived from FAD tracking data. In parallel, to better study FAD density, aggregated summaries per 1° cell and month including number of buoys activated, number of buoys deactivated and number of FAD deployments could be considered.

Smoothed kernel density of deployments of buoys per 1° grid cell during 2017. Maximum number of deployments per cell is 300 in 2017.

Smoothed kernel density of deployments of buoys per 1° grid cell during 2017. Maximum number of deployments per cell is 300 in 2017.

The 2nd paper introduced me to the issue of geo-fenced buoy transmission on FADs by which the data received by PNA are modified by fishing companies prior to submission, for example, information outside PNA Exclusive Economic Zones (EEZs) may be removed presents analyses of the PNA’s fish aggregating device (FAD) tracking programme. Approximately 35% of the fishing companies were found to have geo-fenced more than 90% of their buoys. When buoys are geo-fenced it leads to gaps in the trajectories of a few days to 1 month, limiting the analyses performed on the data.

This very interesting report includes a description of the data processing required; estimated data submission rates to the PNA; a description of the spatio-temporal distribution of buoy deployments; FAD densities; FAD connectivity; and an analysis of the fate of FADs including a focus on FAD beaching. As FADs drift in the ocean, the associated electronics can be changed making it difficult to follow individual FADs, therefore for the purposes of this analysis we followed the satellite buoys unless otherwise stated. 

To better distinguish drifting buoys from those on board vessels, data were analysed using a Random Forest model to identify, and select, the drifting at-sea section of each buoy trajectory, and at the same time identify deployment positions. In addition, using two methods matching buoy tracks and observer or logsheet data, we estimated that ~60–70% of buoy transmissions collected by fishing companies are not forwarded to the PNA. We noted that some of the data received by PNA are modified by fishing companies prior to submission, for example information outside PNA Exclusive Economic Zones (EEZs) may be removed (i.e., “geo-fenced”), which added a bias to the analyses. After undertaking the correction procedure, the cleaned dataset consisted of 14.8 million transmissions from 26,466 buoys and covered the period from 1st January 2016 to 18th March 2018. 

usual image in most Purse Seiners I board. Satlink is the clear favourite brand

usual image in most Purse Seiners I board. Satlink is the clear favourite brand

The number of deployments varied over time, with a total of 36,831 deployments in 2016–2018 (from 193 vessels including 102 buoy owner vessels and an additional 91 vessels where the fishing company was known, but the buoy ownership was not). The spatial distribution of deployments was very similar between observer data and FAD tracking data, both showed the main deployments areas to be in Kiribati South of the Gilberts Islands and East of the Phoenix Islands, Nauru, East of PNG. 

The number of transmissions from buoys almost doubled in 2017 (8.6 million compared to 4.5 in 2016) and the number of individual buoys active in the available data was 10,915 in 2016 and 18,405 in 2017. A decrease in both numbers was detected during the FAD closure in 2016 and 2017, although in 2017, both remained relatively high and constant during the first 3 months of the closure. Although influenced by the issues arising due to geo-fencing, the spatial distribution of buoy densities were investigated, with higher densities in Kiribati South of the Gilbert Islands and around the Phoenix Islands, Tuvalu, PNG and the Solomon Islands. Buoys movement between large grouped areas of the WCPO was also investigated. Patterns varied between areas; for instance, the Southwestern area mostly received buoys from the East and had a high proportion remaining or being deactivated there, compared to the Southeastern area which showed high deployment and emigration rates. 

Not much biodegradable or non entangling in this FADs

Not much biodegradable or non entangling in this FADs

Finally, at least 5% of the buoys ended up beached (probably underestimated as buoys may be deactivated before reaching coastlines), with the connected FAD potentially damaging sensitive ecosystems such as coral reefs. At least 26% of the buoys in our dataset could be considered lost, likely leading to marine pollution.

My own thoughts?

At a personal level, I think the technology associated with the FAD (i.e. the buoys) is amazing, yet as any technology need to be assessed by their impacts. 

On one side the FAD/buoys can be (and are) set to drift across Marine Protected Areas, where they drag the fish (while being monitored from the vessel) which can meet them on the other side and set around them… so it would not surprise me that a lot of effort is now being done on the eastern boundaries of the Phoenix Islands Protected Area- PIPA.  Yet on the other side, one could see it as the potential of having 65000 echo sunders providing is with an unprecedented level of understanding of the stock status in the Pacific, because the information is being collected as we speak… yet that information is not shared with SPC

Hence from the management perspective, it brings a massive challenge, and the only way I see it can be managed is through licensing conditions and costs… stick and carrots approach

Through licensing by having a cap in the number per vessel, having the vessels registering the frequencies directly to the management organizations and linking pairs in between vessels and FAD buoys, and their sharing arrangements. Complex but not impossible, FIMS is doing something along this lines with the allocation and use of Vessel Days (VDS).

Furthermore, as many newer legislations include the possibility of enforcing laws over nationals of Flag states, the buoys provider mainly based in Spain, TW and China could be required to register their units sold frequencies with the regional bodies when that FAD Buoy is sold to a vessel fishing in certain area (as is the case with VMS units). When a set is done, the logbook and observers also record the FAD buoy ID in the forms. The rest is a matter of data management and tiding loose ends.

Then is the carrot, the more transparent the vessel, the more information shared is verified… the lesser the cost of each Vessel Day or other forms of licensing agreements. 


As a mostly operational consultant I’m not in the position to influence the management thinking… but I found that when you deal with fisherman (as I was) it pays to think like them. If you what to deal with them with only the bureaucratic approach, chance are you always going to be running behind the ball


Big Data meets Fisheries Geopolitics by Francisco Blaha

The fact the wealthy dominate any aspect of life should be a surprise to anyone in today’s world but is always good to see some numbers about it. Among the plethora of papers coming from the sudden availability and IAS data here is one that tackles how some nations (mostly without a lot of fish) dominate the catches worldwide by fishing in poorer countries with fish.

Is not the people that work in the ports and boats the ones making the money unfortunatelly

Is not the people that work in the ports and boats the ones making the money unfortunatelly

The paper just published by a group of researchers (mostly from UC Santa Barbara) is one of those that verify facts the one suspects, but at least in my case, I was staggered by the impact of some nations... and you should read the paper here. 

While we know that in the ABNJ (aka high seas) fishing effort is dominated (97%) by vessels flagged to higher-income nations, with less than 3% of effort attributed to vessels flagged to lower-income nations. I was really confronted by the fact that 84% of the industrial fishing effort in lower-income EEZs was conducted by foreign countries, with the majority of this industrial fishing effort (78%) from vessels flagged to high- and upper middle–income nations.

Most AIS-detectable industrial fishing effort that was observed within all EEZs was detected in the Pacific Ocean and the Atlantic Ocean (60 and 35% of total fishing effort observed in all EEZs respectively). Patterns were consistent across the 2 years studied with a nearly identical pattern as recorded in 2015.

The discussion (part of which I quote below) is eye opening;

The new view afforded from this open AIS-based analysis of global fishing activity reveals stark levels of unevenness with respect to wealth class for industrial fishing effort. Globally, 97% of all industrial fishing effort detectable using AIS (on the high seas and within EEZs) comes from vessels flagged to higher-income nations—or 23 million total hours of industrial fishing effort in 2016. This same pattern of dominance by higher-income nations repeats itself on the high seas, within the EEZs of higher-income nations, and within the EEZs of lower-income nations.
On the high seas, 97% of all such fishing effort detectable by AIS is conducted by vessels flagged to higher-income nations. Dominance of this high seas industrial fishing effort at the level of flag nation was highly uneven. 
The vast majority (86%) of this effort can be attributed to only five higher-income countries/entities, in rank order (China, Taiwan, Japan, South Korea, and Spain. When China and Taiwan are analyzed together, they account for approximately 52% of the industrial fishing effort we detected on the high seas, which, by reference, is an amount approximately 12 and 27 times greater than the high seas fishing effort detected for the United States and Russia (two other large nations), respectively. 
The only two lower-income nations that ranked among the top 20 nations with the highest amount of AIS detectable industrial fishing effort on the high seas were Vanuatu and Ukraine (both lower middle–income nations). Vanuatu is a nation with an open vessel registry (colloquially known as a “flag of convenience”) that has been reported to include many vessels owned and controlled by higher-income foreign nations (mostly TW and CN in my experience) (26). The majority of the Ukraine fleet is owned by the Ukrainian government.
Density distribution of global industrial fishing effort, derived using AIS data. (A) Vessels flagged to higher-income countries and (B) vessels flagged to lower-income countries.

Density distribution of global industrial fishing effort, derived using AIS data. (A) Vessels flagged to higher-income countries and (B) vessels flagged to lower-income countries.

Very similar dominance patterns were reported in our analysis of the world’s EEZs, where the majority of AIS-detectable industrial fishing effort within national waters was executed by vessels flagged to higher-income nations. We emphasize, however, that a strongly divergent pattern emerges from our analyses of fishing effort density within the EEZs of higher- and lower-income nations. The vast majority of AIS-detected fishing effort within the EEZs of higher-income countries came from their own fishing fleets. Nearly the inverse was true for lower-income nations, where foreign fishing vessels (mostly flagged to high- and upper middle–income countries) dominated the industrial fishing effort in their EEZs.
Most of the industrial fishing effort in lower-income EEZs was conducted by foreign countries, with the majority of this effort from vessels flagged to high- and upper middle–income nations. 
Globally, the three countries showing the greatest fishing activity in other nations’ EEZs were (from high to low) China, Taiwan, and South Korea. China and Taiwan together accounted for 44% of this global foreign fishing. We detected fishing effort from China alone in the marine waters of approximately 40% of all non-landlocked nations (n = 60 distinct EEZs). China, Taiwan, and South Korea (from high to low) also carried out the highest amounts of foreign fishing effort recorded globally in lower-income EEZs, or approximately 63% of all such effort detected
There are certainly exceptions to the bulk pattern of higher-income dominance of fishing effort in lower-income EEZs. In some lower-income nations, such as India, there was virtually no detectable higher-income fishing within their EEZs. These patterns may be explained in part by national legislation prohibiting or limiting foreign fishing within such EEZs, but could also result from joint fishing regimes occurring within these EEZs.
The patterns of industrial fishing effort within EEZs derived using these AIS-based techniques reinforce and extend conclusions drawn elsewhere using other methodologies and data sources. For example, analyses of fisheries production and trade data reveal a persistent trend whereby wealthy nations fish in the waters of less wealthy nations, but not vice versa (2829).
The relatively recent emergence of the capacity to track industrial fishing effort using AIS prevents examination of the history of this buildup. Elsewhere, however, it has been suggested that the ascendancy in dominance of more wealthy nations fishing within the waters of less wealthy nations (for example, Europe in Northwest Africa) has occurred within the last several decades (28).
Our analysis also does not differentiate between gear types used by industrial fishing vessels. Self-reporting of gear type in AIS data suggests that our pooled analysis of global industrial fishing is dominated numerically (that is, proportion of unique vessels) by trawlers, purse seiners, and longline vessels. Certainly different gear types fish in different ways, which may complicate our estimations of fishing effort made using fishing hours; for example, the extreme time efficiency of purse seiners setting rapidly upon fish aggregating devices is not comparable to more time-intensive fishing methods, such as longline fishing. To investigate the sensitivity of our conclusions to this choice of fishing hours as our currency of measure for fishing effort, we reanalyzed our data measuring fishing effort in the time currency of fishing days. Effort analyses made using fishing days did not change the direction or pattern of our major conclusions for the high seas or within national waters.

I really like their acknoledgement on the limitations of using AIS

We highlight here three major shortcomings of using AIS. First, international and national regulations for the use of AIS and enforcement of these regulations are insufficient in many parts of the high seas and in many EEZs. Many countries adhere to IMO requirements on AIS usage; however, the specifics by which these regulations are codified into national law vary widely, with examples of strict and lax regulation found among both higher- and lower-income nations (9). Second, industrial fishing vessels in lower-income nations may be less likely to carry and use AIS for reasons unrelated to AIS policy. We note that we detected fewer vessels using AIS than are represented on FAO vessel registries and that there is less AIS visibility for vessels registered to lower-income nations. There are a variety of explanations for these discrepancies. For example, some vessels listed by the FAO may have been inactive during our study or regional officials may have overreported fleet sizes to emphasize local growth. By using VMS data derived from Indonesia, we were able to conservatively estimate upper bound corrections for AIS underreporting in lower-income nations. This correction, however, only increases the global contribution of lower-income fishing on the high seas by approximately 6% and within the EEZs of lower-income nations by 29%. A third potential weakness of AIS stems from reliance on a vessel’s reported maritime identification digits (MID) to identify flag state. These MID are typically self-reported and may be entered incorrectly. This also relates to the larger, well-known problem of flag states not always corresponding to the state of vessel control or owner residence [rates estimated at 22.4% based on one analysis (26)], as many vessels operate with flags of convenience to take advantage of lower operational costs, less regulation, and reduced tax liability (2634).
Consequently, many vessels that we class in this analysis as flagged to lower middle– or low-income nations may actually have economic ties that are more closely aligned with higher-income nations. A related important nuance not treated in our analysis is that we do not track the actual firms or companies that own or fund the vessels observed through AIS, despite the influence that these firms have over vessel behaviour.
Collectively, some of these uncertainties and potential biases inherent to AIS data may act to overestimate fishing effort from higher-income nations (for example, reduced visibility of smaller vessels from lower-income nations), and some may act to underestimate higher-income nation fishing effort (for example, a large number of vessels originating from higher-income nations flagged to lower-income nations known as flags of convenience).
Our general conclusion that vessels flagged to higher-income nations dominate industrial fishing on the high seas and within EEZs largely persisted when we aggregated effort by day instead of fishing hour , retested our conclusions using a smaller size threshold (that is, >12 m) for defining industrial fishing vessels (fig. S6), and added a VMS-informed correction for undetected fishing effort in lower-income nations. Nevertheless, responsible interpretation of the new patterns we report using AIS requires direct consideration of all the aforementioned potential weaknesses and uncertainties.

And a polite foray into the reality of Fisheries Colonialism!

On one side, many researchers and managers have expressed unease concerning the potential vulnerabilities that may be created by concentrating dominance over fisheries in the hands of a few wealthy nations. These groups sometimes refer to this skew in control over marine resources as “ocean grabbing” or “marine colonialism” and connect the potential risks involved to those often associated with the practices of land or resource grabbing that occurs when wealthy foreign nations or foreign companies take control of terrestrial or agricultural resources or infrastructure in less-wealthy nations (36)
Significant concern has also been raised about how corruption in some lower-income nations may facilitate misuse of fisheries access payments that prevent such cash from constructively aiding health, development, and growth goals of these nations (171921). Policy options for meeting rising demand for fish in the Pacific region include actions such as diverting some of the tuna currently exported (and captured mostly by foreign fishing vessels) onto domestic markets of lower-income states (39). Another possible opportunity for intervention for stakeholders concerned about foreign dominance of industrial fishing in their national waters derives from the open nature of the data we report and the transparency it fosters.
Access to these publicly accessible data feeds creates opportunities for all citizens in lower-income nations to put meaningful questions to their local leaders regarding sanctioned and unsanctioned foreign industrial fishing in their home waters.
Others have argued that allowing higher-income nations to dominate fisheries presents a desirable and efficient pathway for developing nations to turn their natural capital (for example, fish resources) into financial capital (for example, access fees, license fees, taxes, foreign exchange earnings). Building up a domestic industrial fishing fleet, maintaining it, and servicing it require port infrastructure, a trained workforce, processing and handling capacity, and considerable financial capital—all of which can be challenging to mobilize or lacking in many fish-rich lower-income countries.
Kiribati provides an example of a country where arguments have been made for the efficiency of translating fish into cash. Kiribati is a lower middle–income nation for which we determined that 99% of the industrial fishing effort within its EEZs was delivered by foreign flagged vessels, with the majority of this effort (91%) coming from higher-income nations. Kiribati reported generating 121.8 million USD in 2016 by selling access to fishing rights in its EEZs, with similarly substantial revenues collected in surrounding years (3940). Generally, it is not entirely clear that allowing industrial fisheries from wealthier countries to dominate offshore fisheries within less-wealthy nations’ EEZs always has negative food security impacts. 
The efficiencies of industrialized fisheries allow them to put large quantities of lower-cost fish onto the global market, and this results in a net import of lower-priced processed fish from wealthier nations to poorer nations that, in terms of overall per-capita supply, may help counterbalance the net movement of higher-priced fish from poorer to richer countries (3541).
The capacity to view and analyze large portions of publicly accessible data that reveal how the world divides up a major global resource, like marine fish, is unique. Analogous sources of detailed insight are not, unfortunately, available for other environmentally, socially, and economically important large transnational resource harvest domains, such as logging or mining.
The results presented in this analysis represent data-driven hypotheses surrounding distributions of industrial fishing effort that can be thoughtfully considered during the ongoing high seas biodiversity treaty proceedings at the United Nations and by regional fishing management organizations. This information can help these leaders more effectively pursue shared goals for maximizing equity, food security, and sustainability on the high seas in the near future. These patterns also help to clearly identify which states may stand to win or lose from alterations to the current order of high seas biodiversity management and highlight how the hegemonic powers in high seas fishing can constructively assume more responsibility in leading toward this improved future.
Observations of the apparent dominance of wealthy foreign nations in the EEZs of less-wealthy nations can similarly empower and inspire both citizens and leaders in these regions to have more constructive discussion about best pathways toward securing sustainable and equitable futures for their domestic fisheries. These data also provide an improved understanding of the scope for potential competition between foreign industrial fleets flagged to wealthy nations and domestic small-scale fisheries—competition that is known to create numerous challenges for affected small-scale fisheries and the stakeholder communities linked to these fisheries (6742).
The extent and lopsided nature of the dominance of higher-income flag states in industrial fishing can and should also inform ongoing conversations about how fisheries subsidies reform can potentially curb socioecological abuses associated with distant water fishing (25). Addressing all of these issues is a time-sensitive matter. Significant stresses are likely to be placed very soon upon the food future and political stability of many of the marine regions where we highlight greatest levels of imbalance in regimes of industrial fishing (35).

A five-point "Labour Safe Screen" in seafood supply chains by Francisco Blaha

As may be obvious, I like reading some published papers about fisheries and in particular those from people I know and like. A couple of days ago my colleage and friend Katrina Nakamura as lead author of an interesting group that included other two people I know, Ganapathiraju Pramod and Dominic Chakra Thomson, published a very good paper in the hot topic of labour abuses in the seafood industry.

Crew of chinese longliner

Crew of chinese longliner

As an ex-fisherman, I have written that for me the real “race to the bottom” has been on the crewing side and the relation to forced labour. I don't think that a complicated 18-year-old kid like I was at the time could use fishing today to get through life and pay for its studies. Yet when I came to NZ I was surprised how much better life was on board, and how much more money I got paid (and on time!) we had here in comparison to Argentina and the Pacific Islands where I worked before coming here.

So where you stand and what you are used to makes big difference in this area, so where is the line that separates what is acceptable? And that is what I like the most of this paper, it has, in my opinion, a fresh an balanced approach that gets away from the “developed country saviour” stereotype that other initiatives in the area seem to have.

When I read :

We shifted the basis of screening from attempting to prove or to disprove forced labour conditions in supply chains toward establishing system fundamentals for human rights due diligence.

I was convinced that this is the way to follow, and this paper is one of those that we will see quoted many times! So read the original! I just quote some parts of the original and from this presentation of results here.

Is a complex topic with a lot of regional variabilities. There used to be a good correlation in between the flag of a vessel and the nationality of its crew, in many cases, there was unions or syndicates that, provided boarding rights and negotiated standards conditions, but that is mostly gone.

Today in international fishing particularly by DWFN or by nationals of those nations flagging in developing countries, is labour brokers that's supply a mix of a professional crew from seafaring nations as well as less-skilled and lower-cost crew from quite desperate nations many of them without seafaring experience. The vessels are physically isolated, with working hours determined by ocean conditions and the round-the-clock duties needed to keep a ship operating safely. Payment for work is often a share of the catch value, based on seniority.

The less-skilled crew, who may not speak their colleagues’ language or have any legal standing in the vessel’s flag state, are vulnerable to involuntary and unpaid work. This is particularly the case where the direct employer is a distant labour agent, rather than the vessel’s owner.

Nonetheless, vulnerable conditions alone do not dictate forced labour. Fishing wages provide dignified livelihoods and an escape from poverty for millions of fishers and crew operating in many remote fisheries. But there should be a framework to see when the line is crossed.

And that framework is what this paper proposes, in view that given the complex international nature of seafood trade, private companies have an important role to play alongside national regulations. 

Hence they developed a five-point Labour Safe Screen (and tested it for 118 products). Four of these components are designed to identify the risk of slavery: 

  • product screening for country-level origins and standing on forced labour in seafood
  • a template for mapping the supply chain
  • an algorithm for estimating risk in fishing operations
  • surveys for collecting proof of protective conditions in the workplace.
  • The fifth component is a set of principles for minimum protective conditions in the workplace. 
Field-tested principles for minimum conditions to protect workers from forced labor.

Field-tested principles for minimum conditions to protect workers from forced labor.

The framework combined the use of technology in existing platforms with the collection of industry data and authoritative human rights data. Eighteen food companies used three or more components of the framework and systematically documented their supply chains, engaged suppliers, and cross-checked results. The companies were able to identify areas where working conditions met minimum principles, were unknown, or were inadequate.

Not surprisingly, they found that a data gap separates the industry and human rights sphere. Slavery in seafood was described as a tenacious and prevalent problem in Southeast Asia and international fishing fleets, based on our 12 interviews with human trafficking experts at the beginning of the study period in 2013. By contrast, slavery in seafood was described as an isolated and aberrant problem in eight interviews with senior seafood executives in the United Kingdom, United States, Australia, and Thailand in 2013. The human trafficking experts had gathered significant evidence of forced labour in seafood. However, their organizations had only limited relationships with the seafood industry at that time, limiting their access to data and avenues to effect change. The seafood companies gathered evidence to comply with legal and customs requirements and had limited access to worker data, human rights findings, and avenues to effect change. The data available suggest that the working conditions that allow for forced labour are nuanced, and risk identification requires firsthand worker perspectives (. Any interpretation of forced labour conditions is influenced by language and trust, and any preconceived notions about what a victim of forced labour looks like and how a victim behaves can aggravate consequences for human beings. To collect worker data effectively, both the industry and human rights spheres needed new relationships and methods.

Summary of results
Overall, the 18 food companies in our study used three or more components of the five-point LSS framework and systematically documented their supply chains, engaged suppliers, and cross-checked results. They experienced successes and challenges in trying to collect and verify data in their supply chains, which we have illustrated with examples and details (based on public data and excluding proprietary data). Human rights due diligence was a new concept to the seafood sector in the study period. The methods that worked well were supply chain mapping (component 2) and using supplier and human rights data together (component 4). These were indispensable for seeing previously unknown and at-risk conditions in the supply chain, for example, where brokers are predominant. It was challenging to collect data on working conditions from suppliers with online surveys (component 4). Respondents wanted to comply with their buyers’ requests but were concerned about losing business. The surveys were revised in 2016/2017 in part to de-risk the experience for suppliers and in part to improve the surveys in ways human rights authorities recognize to be legitimate. In the digital program, we found that suppliers did not maintain the labour code of conduct, universal contract, and grievance mechanisms the survey asked for but were familiar with local labour laws and social certification programs. We added an open question to collect all labour diligence efforts and avoid duplication and prescription. In Hawaii, we learned that remediation takes time and community engagement. The chain of custody documents (component 5) were revised in multiple rounds of stakeholder input and field testing to make sense to industrial fishing and seafood employers and to include specific references to the normative framework, for example, the C188 Work in Fishing Convention.
Slavery in seafood supply chains is an incendiary topic, and our intermediate goal was to resolve the finest possible scale of drivers and impacts from trade data and the factual accounts of workers and employers, and their representatives. We observed the drivers of working conditions in 118 supply chains, as well as the large-scale drivers of weak enforcement of labour and fisheries regulations and weak tracking of seafood product origins by companies and customs agencies worldwide. Forced labour in seafood coexists with overfishing, illegal fishing, corruption, and sex trafficking to service fishing fleets—a widespread problem documented by the U.S. Department of State. 
We are contributing interdisciplinary methods that we hope future researchers will use in service of decent work and labour safety in seafood. We learned that seafood companies want their vendors to have systems to identify risks and make improvements and to disclose their efforts. Companies said they wanted each entity in the supply chain producing the good before it reaches them to be responsible for protective working conditions in their operations. They wanted an onramp for the sector, and some wanted a seat at the table for the overall direction of the effort in the sector to ensure that it meets best practice, and particularly that it meets the highest-order legal tests from customs officials. Human rights authorities did not want the work done by companies to be token. They expected companies to use knowledge and resources in the human rights sphere, to act on the findings from workers, and to make their efforts available for verification. The company executives and human rights experts who contributed to our study expected certification programs for seafood sustainability to incorporate human rights due diligence.

Their proposal found that by triangulating industry and human rights data (from proprietary and public data sources), our framework allowed traders to identify the “pinch” points in their supply lines. They could then pinpoint labour risks where corrective actions could be most efficiently focused.

This approach captures data for each workplace as a product moves through the supply chain, transcending national domains and trans-shipping issues. 

The results give traders the tools to identify areas where working conditions are either acceptable, unknown or inadequate. 

Although risk-based due diligence does not guarantee that a product is free from forced labour, it does allow screening of large numbers of products. It can also focus attention on the most urgent points for remedial steps. 

Ultimately, regulatory oversight is the main ingredient for low risk and makes it easier to focus on minimum protective work conditions. So in situations where the regulatory systems are strict and enforced (as in Australia), then minimum standards are likely to prevail and forced labour is likely to be a low risk.

Ideally, robust risk assessment should be part of a multi-pronged strategy for sustainable and socially responsible seafood. As part of this, we should always include ways to hear directly from workers and their organisations at the front line.