What do 2,539,959 Tons of tuna look like?
One thing that never ceases to amaze me from working in the WCPF tuna fisheries, is the vastness and sometimes “incommensurability” of the numbers we work with. Just forgets for the moment we have 17 PS and 9 Carriers in the lagoon… that is a lot in Pacific terms, but not much for other fisheries. But the volumes of fish we (via SPC) estimate is being caught is just mind-blowing.
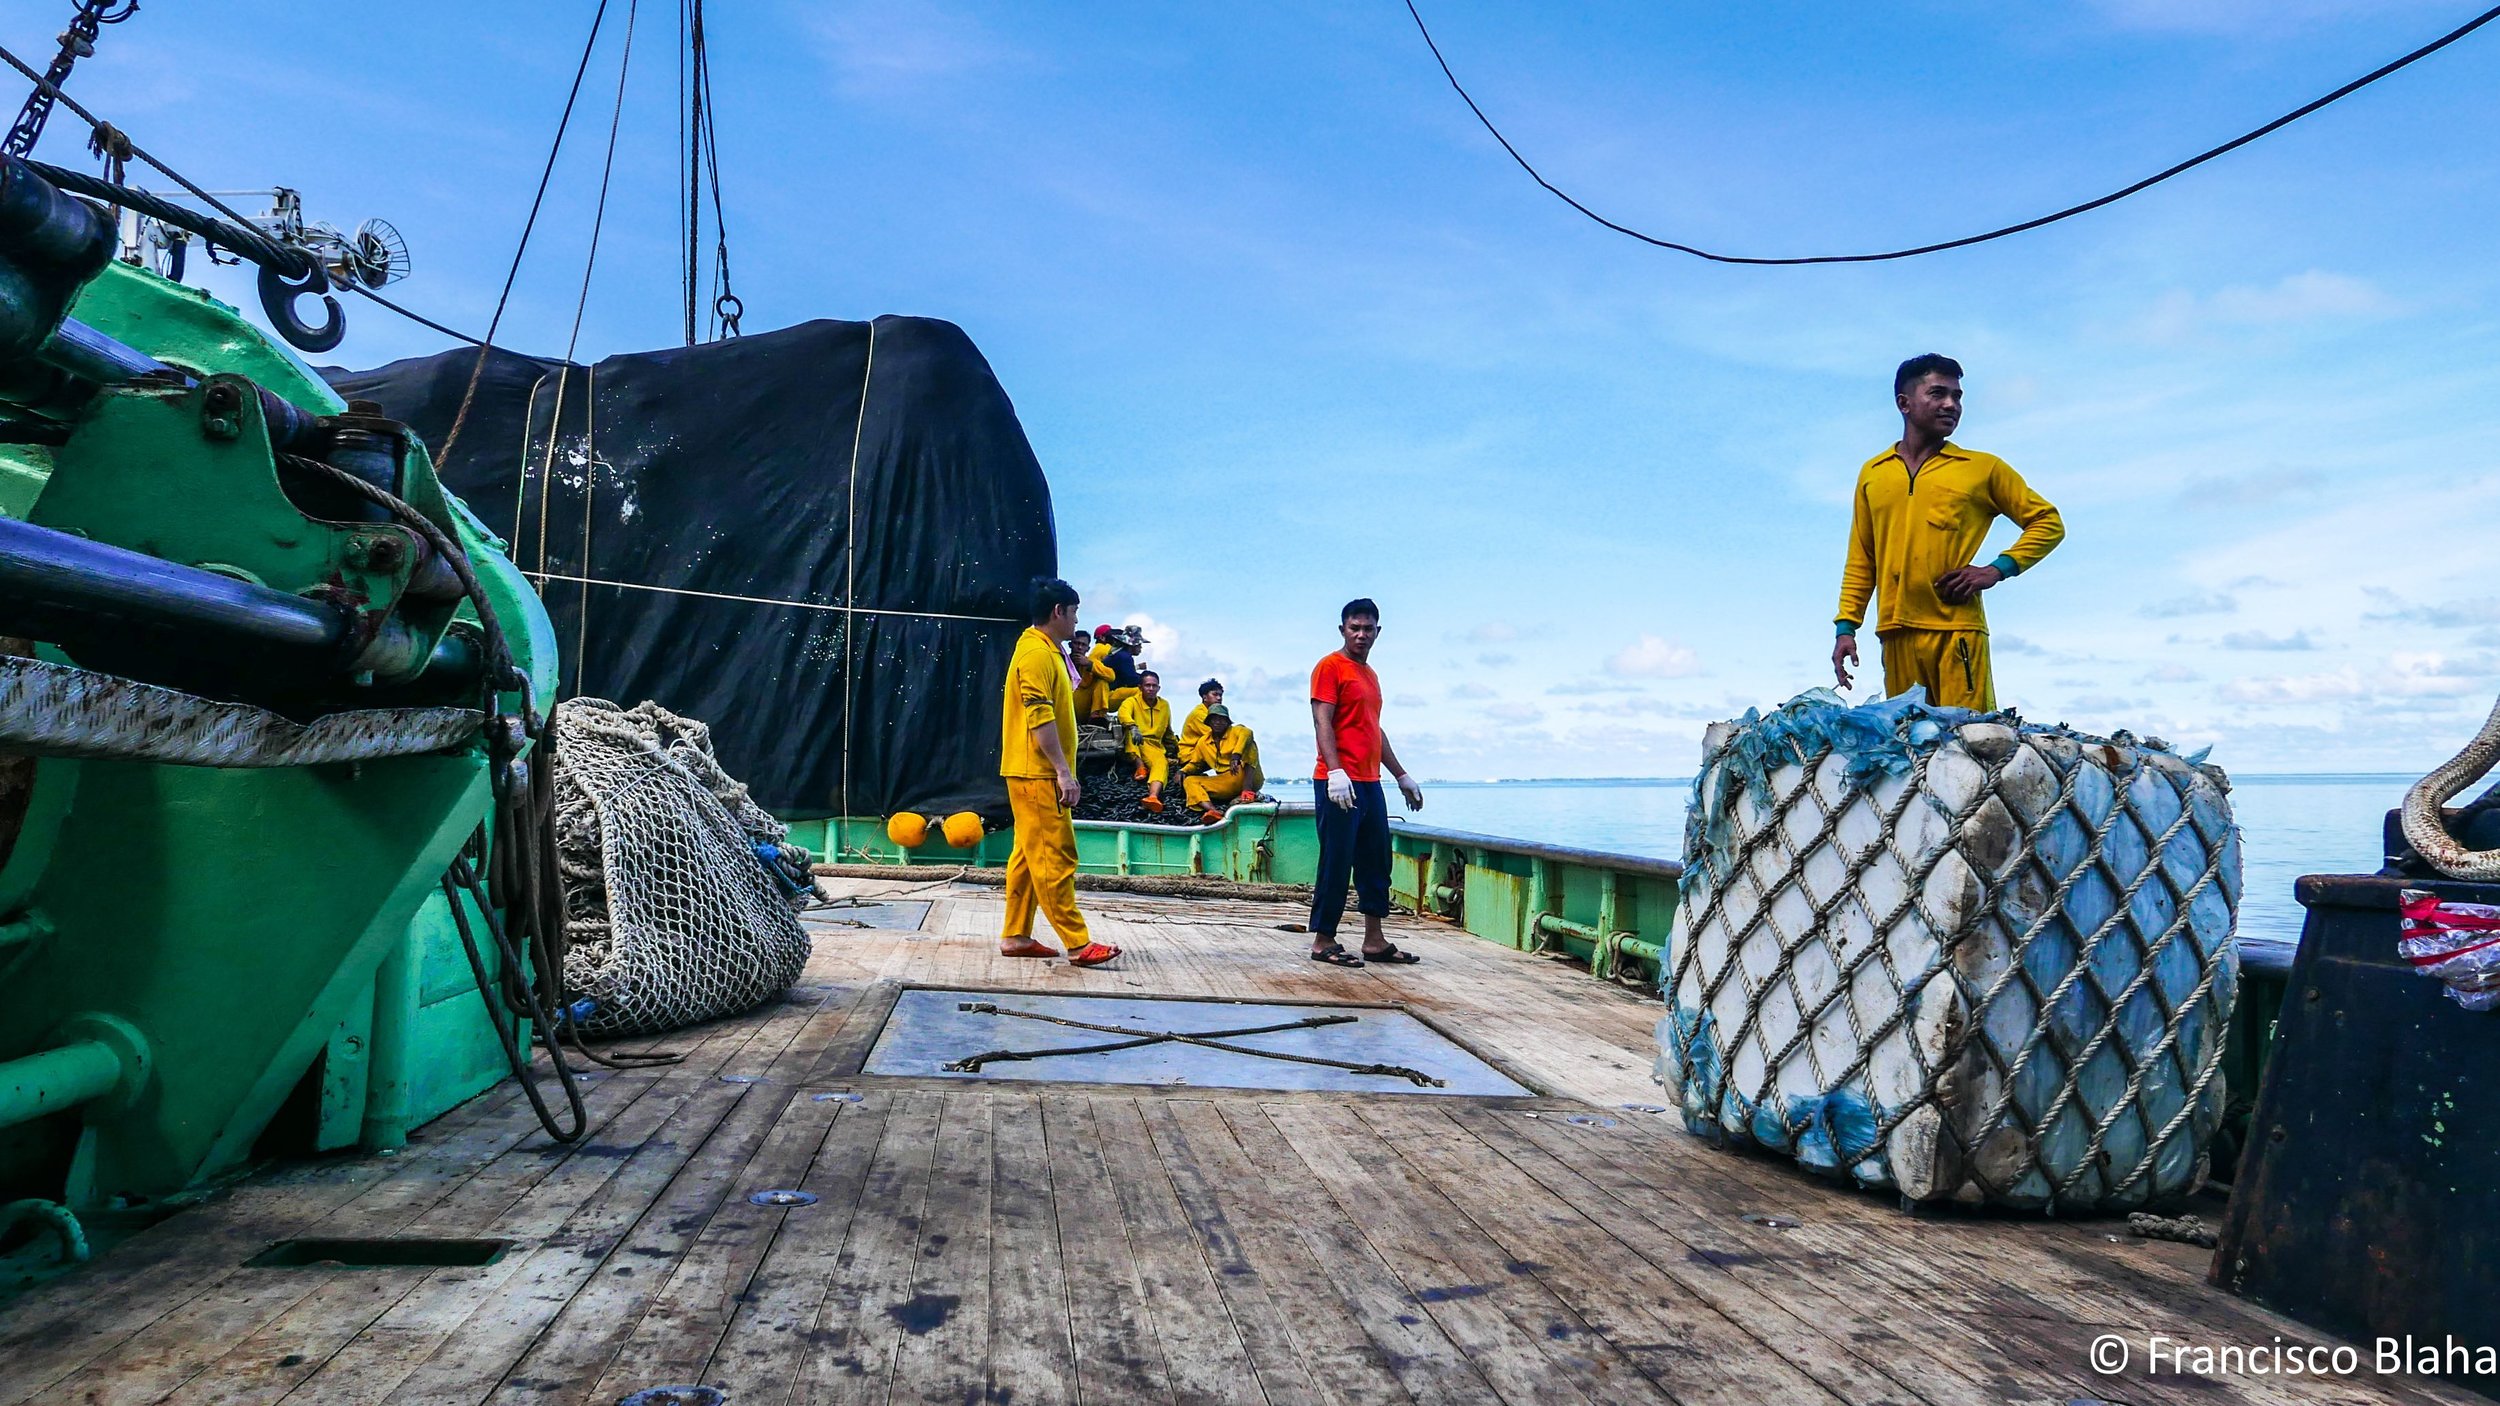
Definitivelly not the guys gettingUS$3.40 billion
Among the many papers we have in TCC, I just quote below the abstract of a paper by my friend and colleague Peter Williams from SPC (one of the people I respect the most in the tuna world) and Chris Reid from FFA. “Overview of Tuna Fisheries in the Western and Central Pacific Ocean,including Economic Conditions 2017”, as usual: read the original.
This paper provides a broad description of the major fisheries in the WCPFC Statistical Area (WCP-CA) highlighting activities during the most recent calendar year (2017) and covering the most recent summary of catch estimates by gear and species.
The provisional total WCP–CA tuna catch for 2017 was estimated at 2,539,950 mt, the lowest catch for six years, and around 340,000 mt below the record catch in 2014 (2,883,204 mt). The WCP–CA tuna catch (2,539,950 mt) for 2017 represented 78% of the total Pacific Ocean catch of 3,239,704 mt, and 54% of the global tuna catch (the provisional estimate for 2017 is 4,715,836 mt, at this stage, the fourth highest on record).
The 2017 WCP–CA catch of skipjack (1,624,162 mt – 64% of the total catch) was the lowest since 2011, at nearly 375,000 mt less than the record in 2014 (2,000,608 mt).
The WCP–CA yellowfin catch for 2017 (670,890 mt – 26%) was the highest recorded (more than 35,000 mt higher than the previous record catch of 2016), mainly due to increased catches in the purse seine fishery.
The WCP–CA bigeye catch for 2017 (126,929 mt – 5%) was the lowest since 2016 and mainly due to continued low longline catches.
The 2017 WCP–CA albacore catch (117,969 mt – 5%) was slightly lower than the average over the past decade and around 50,000 mt lower than the record catch in 2002 at 147,793 mt.
The south Pacific albacore catch in 2017 (92,291 mt) was a record catch, primarily due to a record in the longline fishery (89,388 mt.); the 2017 catch was around 4,000-5,000 mt. more than the previous record catch in 2010 of 88,147 mt.
The provisional 2017 purse-seine catch of 1,812,474 mt was slightly less than the most recent five-year average, and nearly 250,000 less than the record in 2014 (2,059,008 mt). While the total purse seine catch in 2017 was similar to the 2016 catch level, the species composition was clearly different.
The 2017 purse-seine skipjack catch (1,280,311 mt; 71% of total catch) was the lowest since 2011 and nearly 350,000 mt lower than the record in 2014.
In contrast, the 2017 purse-seine catch estimate for yellowfin tuna (472,279 mt; 26%) was the highest on record at nearly 50,000 mt higher than the previous record (423,788 mt in 2008); this record was mainly due to good catches of large yellowfin from unassociated-school set types in the west and central tropical WCP-CA areas (see Figure 3.4.8–right).
The provisional catch estimate for bigeye tuna for 2017 (56,194 mt) was a decrease on the catch in 2016 and lower than the most recent five-year average.
The provisional 2017 pole-and-line catch (151,232 mt) was the lowest annual catch since the mid-1960s, with reduced catches in both the Japanese and the Indonesian fisheries.
The provisional WCP–CA longline catch (240,387 mt) for 2017 was lower than the average for the past five years. The WCP–CA albacore longline catch (96,280 mt – 40%) for 2017 was higher than the average catch over the past decade, and only 5,000 mt lower than the record of 101,816 mt attained in 2010.
The provisional bigeye catch (58,164 mt – 25%) for 2017 was the lowest since 1996, presumably mainly due to continued reduction in effort in the main bigeye tuna fishery.
The yellowfin catch for 2017 (83,399 mt – 35%) was lower than the average for the past decade and more than 20,000 mt less that the record for this fishery.
The 2017 South Pacific troll albacore catch (2,508 mt) was similar to catch levels experienced over the past four years. The New Zealand troll fleet (111 vessels catching 1,952 mt in 2017) and the United States troll fleet (13 vessels catching 556 mt in 2017) accounted for all of the 2017 albacore troll catch.
Market prices in 2017 generally improved with significant increases in prices for purse seine caught skipjack and yellowfin, pole and line caught skipjack and longline caught yellowfin, swordfish and striped marlin while longline caught albacore prices remained steady and longline caught bigeye prices were either steady or declined.
The total estimated delivered value of catch in the WCP-CA increased by 12% to US$5.84 billion during 2017.
The value of the purse seine catch (US$3.40 billion) accounted for 58% of the value of the catch, the fishery’s 2nd highest contribution to total catch value.
The value of the longline fisheryin 2017 (US$1.46 billion) was the lowest since 2007 and accounted for 25% of the value of the catch, its 2nd lowest contribution to total catch value.
The 2017 values of the pole and line, and other catch were US$348 and US$631 million respectively.
The value of the 2017 WCP–CA skipjack catch(US$2.98 billion) was the equal to the third highest recorded and 13% higher than 2016.
The 2017 value of the WCP–CA yellowfin catch(US$1.9 billion) was the second highest recorded and 17% higher than 2016.
The value of the WCP–CA bigeye catch in 2017 (US$0.65 billion) was at its lowest level since 2005.
The 2017 value of the WCP–CA albacore catch (US$0.34 billion) was around that averaged over the past 10 years.
Economic conditions in the purse seine, tropical longline and southern longline fisheries of the WCP-CA showed mixed results. The southern longline fishery saw a further improvement in catch rates which drove the FFA economic conditions index to its highest level since 2009.
Conversely, the tropical longline fishery index, which moved above its long term average in 2016 for the first time since 2010, fell back to below the long term average.
In the purse seine fishery, despite significant falls in purse seine catch rates, higher prices resulted in the continuation of the good economic conditions in 2017, with the FFA purse seine fishery economic conditions index increasing marginally from 2016 to be at its third highest level since 1999.