Request for participation in FAO survey on marking & tracking dFADs by Francisco Blaha

When I was a fisherman (and even today) I complained complain that rules and management policies were not designed to be user-friendly and in some cases impossible to follow. A classic line is: "Obviously the people behind this, have no idea of what does really happens on board". So if this rings a bell, here is your chance to help make better management tools by completing a short survey, so you don't have to complain later!

FADs in the making

FADs in the making

My colleague Dr Eric Gilman, on behalf of my former employer FAO, is conducting yjos survey to obtain comments to improve a section of FAO’s Draft Guidelines on the Marking of Fishing Gear on marking artificial drifting Fish Aggregating Devices (dFADs) used by purse seine tuna fisheries, to identify ownership and track position. The survey also collects views on measures adopted by the tuna RFMOs on FAD marking and tracking.

The survey results will be published as a FAO Fisheries Circular, which will be presented to the participants of the FAO Gear Marking Technical Consultation in Feb. 2018 in order to improve the guidelines on marking and tracking FADs.  

WCPFC, IATTC and IOTC secretariats have distributed circulars to their commissioners requesting their support (e.g., see https://www.wcpfc.int/node/28750). 

More information on the project, including the survey form (available in English, Spanish, French, and traditional and simplified Chinese), is available online at http://tinyurl.com/FAD-mark

Eric's work would be as good as the quality of the data he collects, so if you have dealt with drifting FADs at any stage of your career, provide a few minutes of your time for a better-managed fishery. 

Eric is with the Pelagic Ecosystems Research Group of the College of Natural Sciences at Hawaii Pacific University 

The SPC Fisheries Newsletter by Francisco Blaha

For many years now my friend and colleague Aymeric Desurmont (SPC's Fisheries Information Specialist) has been in charge of the SPC Fisheries Newsletter. In this world full of fisheries misinformation, this newsletter is a must read for the region, and I personally think that it should be celebrated and acknowledged way more than it is at the present.

fishing for food and fun in Noro

fishing for food and fun in Noro

The newsletter is always interesting reading as it offers varied topics pertaining from the region in a very scientific manner, but also has a "person" approach to some of the topics. We so easily forget that fisheries are as much about people, as it is about fish. 

Thank you SPC and thank you Aymeric for your excellent work over the years. My total respect for that!

The Number 152 (January–April 2017) is here, and the editorial below

Participants of the SPC Heads of Fisheries Meeting, in March (see article here), highlighted the need to raise the profile of coastal fisheries, given their importance for food security in the Pacific Islands region, and concluded that coastal fisheries should find a higher place in the list of priorities of their governments and donor agencies. I’m not sure if it is already a side effect of this call, but the list of articles we received for this issue certainly highlights the importance and diversity of coastal fisheries-related work being done in our region.

The fishery sector includes some of the most dangerous jobs in the world, globally causing over 20,000 deaths per year. But, in the public’s mind, this danger is more associated with industrial fishing in extreme weather conditions than with artisanal fishing in relatively benign tropical waters. Nevertheless, anyone who has ventured outside the reef on a small outboard-powered boat is well aware that disaster is never far away. Engine failure combined with offshore winds can make for a very long and possibly fatal drift.

In Tuvalu, three drifting fishermen were saved by the activation of personal locator beacons, devices they had received from their government as part of a safety “grab bag” (see articles here and here). Each grab bag cost USD 1,200 – a very minor investment when compared to the cost of air search and rescue, or the loss of a life. The Tuvaluan government decided that the safety of artisanal fishers was a high priority. Three fishermen and their families will be forever thankful for this wise decision

PacfishID, a new app to identify common coastal fish in the Pacific by Francisco Blaha

The Pacific Community (SPC) has just released PacFishID, a new mobile application for learning how to recognise Pacific marine fish species. Just like Tails, a catch-data collection application launched by SPC last year, this app uses technology to improve resource management.

The first dataset available on PacFishID is based on SPC’s recently published Identification guide to the common coastal food fishes of the Pacific Islands region. This guide was initially produced to facilitate the work of fisheries officers during market and landing surveys. But the number of copies downloaded since its publication shows that it has reached a far wider audience.

The fun-to-use app works offline once the data and pictures have been downloaded and contains detailed information on marine species classified by family.

Each fact sheet shows a species’ identification keys, maximum size and the Pacific countries or territories where its presence or absence is either scientifically confirmed or probable.

Users can test their fish-name knowledge with the quiz function’s progressive multiple-choice test that gets harder as the number of right answers increases.

The app is available at:

Apple Store https://itunes.apple.com/us/app/pacfishid/id1238553695?mt=8

Google Play https://play.google.com/store/apps/details?id=spc.pacfishid&hl=en

and Windows Store https://www.microsoft.com/en-us/store/p/pacfishid/9nvg3dkqj0th

It is currently available in English only, but a French version is in the making.

The app will be upgraded with more datasets including offshore and aquarium fish, invertebrates, marine mammals, sea turtles and seabirds.

Transhipment, Boarding and Inspection Training Workshop in FSM by Francisco Blaha

For the last two weeks, I have been working here in Federated States of Micronesia invited by my colleagues from FFA and from NORMA (the local fisheries authority) as resource person and trainer in during Transhipment, Boarding and Inspection Training Workshop that took place in Pohnpei.

The 7 columns of acronyms that you see on the back wall are just the start of the complexities of MCS work in a multi-state fishery like the one we have here in the Pacific :-)

The 7 columns of acronyms that you see on the back wall are just the start of the complexities of MCS work in a multi-state fishery like the one we have here in the Pacific :-)

Interestingly the workshop took place while everyone was at the UN Ocean Conference in NY starting with a "tuna traceability declaration". But for that to take effect a lot of work still need to be done setting up the basics for it.

Unloadings need to be first assessed as legal, and then need to be accounted, yet that is easier said than done.

Officers are typically trained through the FFA process, including MCS and dockside boarding and inspection training. Yet by their nature, these trainings are aimed at the procedural and enforcement level, with limited involvement in the pre-arrival screening of vessels, logsheet assessment or the evaluation of volumes unloaded, and equally important; volumes exported as to detect fish laundering.

My contribution aims to provide a fisherman's perspective not only on the formal elements of harvest legality and enforcement but to the approaches associated with logsheet evaluation and data verification from other documents such as captain's logbook, engineers logbook, plotters, etc. as well as catch landings and transhipment monitoring.

Furthermore, I always like to give bring attention to the ‘why” are these activities are necessary and not just “how”.

Off to a boarding (and looking the part) :-)

Off to a boarding (and looking the part) :-)

We also had the opportunity to work with FFA's new Boarding Officers Job Aid Kit (BOJAK) App, that set all the paper based boarding forms into electronic forms, and provides on demand technical and compliance data in regards the boarding vessel. Then allows for the transmission of data via 3 types (Wi-Fi, Cellular or Satellite) connection automatically into the FFA IMS (the set of Fisheries Apps we have in the Pacific is going to be the matter for another blog)

I really do enjoy this type of work, and get a kick of getting to the boats, sharing my insiders' experience and get the feedback of the good people I’m working with.

I wish to thank my FFA colleagues Peter Graham, Dennis Koroi, Kenneth Katafono and Pole Atanraoi-Reim for the opportunities and trust extended during the workshop.And to Suzzane Gallen, Justino Helgen and Preleen Martin for NORMA for organising a superb event.

The great FSM team

The great FSM team

"One size does not fit all" - Frank Zappa on MSC P3 for Tuna? by Francisco Blaha

I have been quite open about my issues with eco-labelling, as well to the fact that I respect in principle the work that MSC does. I went through their standards many years ago prior to the 1st certification of the Hoki Fishery in NZ. The 3 principles structure is solid, mainly because it tackles a fishery in its entirety (I have absolutely no time for any of the other approaches)

do we get a price plus just for being legal?

do we get a price plus just for being legal?

I still uncomfortable with them for reasons I described before here.

Recently I had the opportunity to go over all tuna MSC certified fisheries in the Pacific with a focus on Principle 3 “Effective management” and in particular the last two performance indicators and scoring issues,  “Compliance and enforcement” and “Monitoring and management performance evaluation”.

And honestly, except the Trimarine Solomon Islands one (5 purseiners and 2 pole&liner vessels fishing in national waters only), I don't get how they were able to score a “pass” on some of these issues.

I have no major issues (nor the knowledge) to question much on Principles 1 (Sustainable fish stocks), and 2 (Minimising environmental impacts). Most of the performance indicators and scoring issues are about work done by SPC for the WCPFC. While dependent on the quality of the data provided the methodologies behind are relatively independent of the different flag states involved in the fishery, since the key decisions do take place at WCPFC.

However, there are voices that question that the fishery "should only be certified as a whole, for its total operations, and not on “artificially construed components of the fishery”, referring to the mixed free-school and FAD fisheries in the WCPO, as I reported before here.

Back to the part I understand best, some key compliance performance indicators of principle 3, rely totally on the flag state performance and individual vessels compliance history, yet it is the client that has to provide this information. Which in some cases it would be better to hide yet in others he may not have access.

MSC expects that “Where possible the certifiers will seek independent and credible information, and would typically meet with the relevant compliance and enforcement agencies” but then, what they expect the poor performing flag state authorities to say? Other than: "we are great".

In most of the certifications, the unit of assessment – UoA (the set of vessels involved), are flagged to various flag states including DWFN (mostly associated with traders networks). Many of these DWFN have a poor record of performance. Yet in none of those certifications, they seem to be an independent verification of compliance or time spent reviewing records in the fisheries agencies in those lesser performing flag states.

Furthermore, why would the fisheries authorities of these poor performing countries allow a private consultant to dig into their MCS and enforcement data (assuming they have it available).

As an example, one of the scoring issues is “Systematic non-compliance”. I have some level of access to regional compliance databases and vessels compliance indexes, so I searched the names of some of the vessels I know are part of certified fisheries. The results were shocking in some cases. Of course, I cannot divulge this information without breaking my confidentiality agreement, even if I think that all compliance data should public.

In general, the compliance history of these vessels tends to reflect the attitude of conformity of the skippers and owners, particularly when it comes to systematic compliance issues in assessment scores. Furthermore, it shows what is the real compliance capacity of the flag states.

I struggle to understand how come Principle 3 can be evaluated without that info being available for each flag state under the UoA. On the other side, can we expect the client to have access to this data if they are not the Flag State Authority or the vessels owner? Or assuming he is keen to pass that information to his detriment?.

Perhaps is simply the case that the MSC Principle 3 was not designed for multi-state fisheries like tuna, but more for fisheries where flag / coastal / port / processing state are combined (and there are many of those)

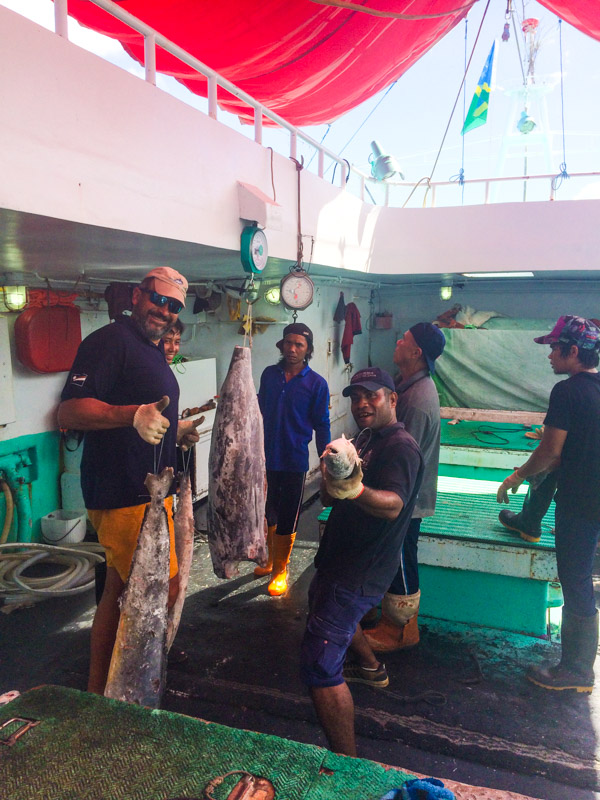
Personally, and based on my observations from the fishing ports, I feel that the “motivation” of the vessels involved is more to “whitewash” their names and score a bit more of money that for sustainability issues.

In fact, the certified vessels are doing nothing more of what they should be doing: following the rules. Perhaps if they were to catch less of what they are allocated or giving up vessel days, then I see a sustainability drive, otherwise we are rewarding legality like if it was something special.

Furthermore, from my usual job checking training boarding officer on purseiners, I have noticed free-schools sets in the evenings or prior sunrise. From my experience, the only way to do a free school set at night is with a perfect full moon and even so is very weird.

I suspect that “free schooling” (new verb!) of FAD-associated school is going on (while the observer sleeps?). The support vessels will temporally remove or push away a FAD and then the Purse Seiner drift towards that location at very low engine revs while keeping a sonar eye on the biomass, then the school will naturally move and associate with the Vessel. Once at a safe distance, voila, you have a ‘free school.”

The other issue that bugs me is something I explained before, is what as a friend defined as MSC stands for “Mushy Skipjack in a Can” due to the soft texture of the fish. And this is something I heard now from various processors (in fact I will be codirecting a thesis on this).

Looks like with the influx of "FAD-free" fish, the canneries are encountering a much higher percentage of fish with really “soft texture,” hence the levels of rejections and downgrading has increased.

This “soft texture” may have something to do with a higher level of enzymatic reactions, and the higher body temperature of fish caught while actively feeding in a school during the day, as opposed to fish caught while lazily circling a FAD in the very early mornings.

In any case, this is a truly wicked twist in this saga, since if the level of rejections has increased which means that more fish is sent to the fishmeal factory. As the canners work against volume orders that they need to cover, more fish needs to be caught as to fulfil the contract, so the whole situation it is going against what any sustainability measure should aim for: catching less fish.

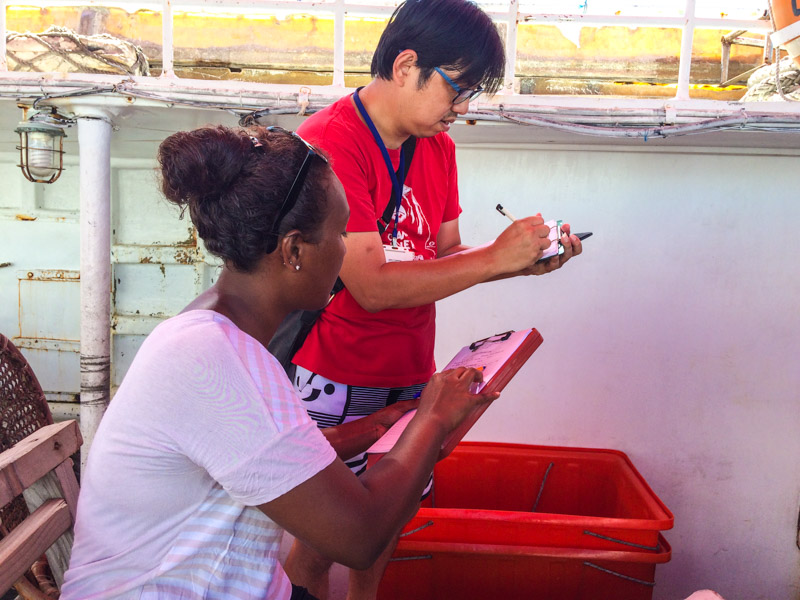
Finally, I’m not comfortable with the use of fisheries observer to “guarantee” the “catches and chain of custody” something that is only required in the Tuna Fisheries.

In the Pacific, observers have a lot on their hands already, scientific data, compliance and MarPol, in an already complex set up. So having them involved in a private commercial enterprise does not seems ethical nor fair. While observers are getting a payment plus for the MSC work, these may offer chances were a conflict of interest may arise. Furthermore, the observer is supposed to stay on board for landing or transhipment of MSC catch, which is quite a lot to ask for an observer when he gets to port.

Today for 3rd time in this year, while training officers on vessels clearance to assess the legality of catches and monitoring transhipment volumes, on vessels that had MSC catch. I've seen that no observer was controlling the mixing of certified and non-certified fish

I want to make clear that I’m not trying to fire cheap shots to MSC, I believe that it does work for some fisheries (even I don't share why we need ecolabels), but perhaps wasn't designed for the complexities of multi-states fisheries like tuna. And this should not surprise anyone after all Frank Zappa said it many years ago: "One size does not fit all.”

Domino effects of cumulative bias and erroneous data in fisheries big-data mapping models by Francisco Blaha

A couple of months ago I wrote on the report of Global Footprint of Transshipments produced by Global Fishing Watch and then on the methodology used. I was quite positive about it, recognising that the base tool AIS, while limited in their application to fisheries, is not totally useless.

The business of transhipemnts 

The business of transhipemnts 

Now the other side of the bell rang, and a report by Roberto Mielgo Bregazzi from FishSpektrum (i+D).  I don't know much about them, yet they look like as a solid outfit that defines themselves as:

FishSpektrum Project (FSK) is a multidisciplinary “big-data” project focused in improving knowledge on global fisheries activity and historical footprint that combines the identification of vessels and their fishing capacities as well as their targeted fishing grounds
FSK's core is based on a Unique Fishing Vessel and Fish Carrier Vessel Identifier Database (UFVFCID or Krakken) that currently accounts for some 1.697.327 fishing-unit references and should reach the 2 million mark by the end of 2018, thus already the single largest and most robust existing fishing vessel database in the world, largely doubling FAO’s Fishing Vessels Finder (FVF) data content.

The report is a critical in-depth look on the GFW one, and from what you can see in the abstract (quoted below) is not particularly complimentary of it.

Cumulative-biases in fisheries big-data mapping models have a domino effect that inevitably culminates in independent innovative and worthy technological projects failing to deliver the scientific rigour that is expected of them.
Worse still, they open up such projects to the charge that the over or under-reporting in their findings and the lack of rigour in their statistical analysis is down to politically biased vigilantism, skewed more towards media environmental activism rather than a true reflection of the situation at sea.
Moving from public-facing awareness- raising tools to credible independent Monitoring Control & Surveillance (MCS) systems that help bring rogue fishing industry to order, such is the challenge facing the independent fisheries MCS intelligence community.

Science advances by contrasting research and educated criticism on a subject. I don't have the technical knowledge to have an opinion on the accuracy of these two reports, yet I celebrate that they are out there and deepening the understanding in an area that is going to get more and more important. 


No storing fuel on fish wells anymore, if you want that Tuna to go to the EU... by Francisco Blaha

A couple of weeks ago I commented on the EU's FVO (now Directorate F of DG SANTE) findings related to the common practice of using the fish wells to transport fuel in purse seiners and longliners.  At the time I could not go into too many details because the reports weren't published. They are now.

Smells more than fishy in there...

Smells more than fishy in there...

While the this is not the 1st time the FVO found this issue they have grounded their rationale in these two published reports for Ecuador and Colombia. You can download the reports from the links under each countries' name.

This will have a big impact on the logistic of the fleets and on the Competent Authorities (CA) of flag States authorised to export fish to the EU that controls them. 

From now on, if an inspector of a CA of the country (the flag state) authorised to export to the EU verify this practice, then the fish in that well would not be elegible for the EU.  Furthermore, if the practice continues, that vessel should be taken out of the EU approved list, hence all its production is not eligible to the EU (either directly of via any processing company that exports to the EU)

The interesting question now is, what is the role of the CA in a Port State if they are required to verify the conditions of unloading and they see that the vessel is loading fuel in a well. Should they inform the responsible CA (the flag state one) of the issue?

If it was a fishery non compliance they should under PSMA (Port State Measures Agreement) but there is no such an obligation for the EU market access requirements other than good practices and due diligence.

Jope can guarantee that no Fuel has ever been there... we don't need to do it, we fish near by and we don't get fuel subidies. 

Jope can guarantee that no Fuel has ever been there... we don't need to do it, we fish near by and we don't get fuel subidies. 

what a fish well looks like... 

what a fish well looks like... 

Has the EU an effective fisheries control system in place?  by Francisco Blaha

A very good report by the European Court of Auditors was recently published and it makes for interesting reading. The court's job is to audit the effectiveness of different bodies and EU-wide policies. This time their question was a simple, yet amazingly complex to answer: “Has the EU an effective fisheries control system in place?” 

Fisherman in Vigo, Spain

Fisherman in Vigo, Spain

They approached the issue from various sides and found quite challenging answers. I’m not gonna go over the whole report (read the original), but it was on one side reassuring, and on the other side worrying to read statements like this:

In general, the Member States we visited planned and carried out fisheries inspections well. However, the fact that inspectors did not have real-time access to information about vessels reduced the effectiveness of inspections. Member States had established standardized inspection procedures, but we found cases where available report templates had not been used by inspectors. The inspection results were not always correctly reported in the national databases. We also found that sanctions applied were not always dissuasive. The points system, one of the main innovations of the current control regulation intending to ensure equal treatment of fishing operators, was applied to very different extents across Member States we visited and even within the same Member State. Finally, there is currently no European register of infringements and sanctions, which would allow a better follow-up of points applied, a more effective risk analysis and enhanced transparency among Member States. 

Reassuring, because there are parts of it I could have written for many of the small Pacific island developing states I work with “had established standardized inspection procedures, but we found cases where available report templates had not been used by inspectors. The inspection results were not always correctly reported in the national databases. We also found that sanctions applied were not always dissuasive… there is currently no register of infringements and sanctions”. Hence if this is the situation in the richest and organised countries in the world, then we deserve some slack. Furthermore, we do have “real-time access to information about vessels” and we have also a developing register of infractions.

Worryingly, because many of the countries I work with got issued yellow cards for reasons that are no too different to some of the ones I read here. And these countries made substantial efforts that if we were to measure them as % of GDP are way bigger that whatever the EU states need to do to be shining examples of good practices.

To the EU’s praise, I have to say that I only read this type of information out of them themselves, and that has to be applauded. Yes, they have problems and they publish them for everyone to read. Total transparency. Something like this published by China or Taiwan would be unthinkable, yet totally necessary.

The other bit that really surprised me is the section on VMS, I quote:

On analysing the information in the EU fleet register, we found that 2 % of vessels that were over 15 metres long and were licensed to fish had no VMS, contrary to the requirements of the Control Regulation. The Commission had detected this irregularity but it had not been corrected at the time of the audit.  Due to the limited requirements of the Control regulation, at 31 December 2015, 89 % of EU fishing vessels included in the EU register did not have VMS equipment on board. Of these, 95 % were vessels under 12 metres long, which are not required to have VMS under the Control Regulation. Most of the vessels between 12 and 15 metres long (79 %) were exempted from the VMS obligation by Member States. We recognise the need to avoid overburdening operators of small vessels with expensive and complex localisation systems. However, the fact that an important part of the fishing fleet is not equipped with VMS represents a significant gap in the fisheries management system.

I totally understand that smaller vessels (>10m) should be exempt, yet for 79% of vessels in between 15-12mt to be out, is surprising. 

The one that wasn't surprising for me* was the following:

In the Member States visited, the VMS systems were generally being correctly used to plan inspections and monitor the fishing activities of vessels linked to the system. However in Italy, unlike the other countries visited, the system did not produce automatic alerts when fishing vessels entered restricted fishing areas, to enable the authorities to check whether the vessel was authorised to fish. Member States sometimes set more stringent conditions than those required by the Control Regulation. For example, in order to better check vessel activity under the national Mediterranean management plan, Spain required all purse seiners and trawlers, regardless of size, to be linked to the VMS. Moreover, some regional authorities in Spain required all vessels fishing in certain protected zones to be equipped with simpler (non VMS) localisation systems.

So basically, good on the EU for being transparent about their problems, yet remember them when you point fingers to others ☺

*Fishing back in Argentina was mostly managed by Italians migrants, and they weren’t very compliance oriented. Spain on the other side keep showing leadership in changing their compliance performance.

Global Fisheries MCS Evaluation Report by Francisco Blaha

I have known Pramod Ganapathiraju for a few years now, (even if never actually meet in person I think). He has been involved in various areas of the IUU scene. My initial contact with him was in regards his  “anchor point and influence” methodology to examine illegal and unreported catches.

MCS in Action

MCS in Action

The idea was to use empirical data from a wide variety of sources to establish “anchor point” estimates of the upper and lower bounds of illegal, unreported and unregulated fishing in each tuna fishery in different countries top 3 tuna species.  Monte Carlo simulations would be then used to investigate the effects of uncertainty, with 1000 simulations across the distribution of uncertainty. The aim was to estimate IUU catches for each of the tuna products caught from both within Exclusive Economic Zones (EEZs), the high seas and Regional Fisheries Management Organizations (RFMOs) waters. The proposal, unfortunately, did not get funding, but we stayed in contact.

He recently started publishing country reports from a mammoth Policing the Open Seas report, a global evaluation of Fisheries Monitoring Control and Surveillance to date covering more than 80 countries.

His report document’s latest information to draw a picture of the gaps & strengths in MCS infrastructure, inspections and capabilities in each nation to tackle and control Illegal, Unreported and Unregulated (IUU) fishing. 

Over a period of five years, more than 180 enforcement officials, MCS experts and Government officers from 84 countries were contacted for consultation and feedback at different stages of this MCS analysis. 52 confidential interviews were also conducted with enforcement officials in developing countries. 

There is hardly any published literature to estimate MCS effectiveness in the fisheries sector and hence his global study constitutes a unique resource.

As he is doing this self-funded, I asked why he took on this? Below is what wrote back to me:

I initially started on a pilot scale as a purely research based study for my Doctoral research over 5 years (2007-2011), and I published preliminary results of 41 countries on May 2011 (Pramod 2011). The results for the 41 countries was presented with a description in Pramod (2012). The range of attributes used in the questionnaire for the 2011 study was rather limited, but after completion of my PhD and once I resumed full-time consulting I contacted several key experts in Military and civilian agencies to make the attributes for scoring the 12 questions more robust. 
The study was then extended to 84 countries and using a wide range of interviews, phone calls and e-mails & assistance from fellow consultants I was able to get feedback from enforcement agencies and civilian agencies over a five year period. In the beginning, many fisheries related ministries and military agencies (Coast Guard or Navy) back in 2012 were reluctant to provide feedback citing confidentiality of MCS data. 
But after evaluating my request and case study questionnaire I received feedback from 75 countries. In many cases, I had to call the concerned person to explain the motivation behind the study before feedback was received and cited in Anonymous format. The range of feedback received ranged from a single response from fisheries ministry in the country concerned to 5 different responses from different agencies (ports, customs, fisheries, Coast Guard, etc.). 
Twelve of the 84 country reports were released online since April 2017 and another 10 reports would be made public in the coming months (http://iuuriskintelligence.com/global-fisheries-mcs-report/)
Note that all country evaluation documents are a ‘living document’ and may change with time. I remain open at any time to comments, corrections or adjustments. Just contact me.

Beyond any opinion, one may have on the accuracy of the individual reports by insiders knowledge, the task is impressive and good on him for tackling it.

And as some said to me once “no project is perfect… they are all perfectible!” so if you think you know better, get in touch with him and help make them better!

References
Pramod (2011) Evaluations of Monitoring, Control and Surveillance in marine fisheries of 41 countries, MCS Case Studies Report, Fisheries Centre, University of British Columbia, Canada, May 2011, 222 pages.

Pramod (2012) Illegal and unreported fishing: Global analysis of incentives and a case study estimating illegal and unreported catches from India. PhD Thesis. University of British Columbia, Vancouver, Canada, 343 pages (https://open.library.ubc.ca/cIRcle/collections/ubctheses/24/items/1.0072627)

One Noro at the time by Francisco Blaha

By some reason, weekends are busy days in most fishing ports in the world, the cynic in me thinks it has to do with the fact that most fisheries administrations (as most non-emergency related public servants) work Monday to Friday. Not in Noro, the fisheries office here run 7 days a week.

IMG_7341.JPG

We have NFD's 6 PureseSeiners, two Pole&Line (all locally flagged and crewed) unloading exclusively for Soltuna cannery and then various Taiwanese Longliners that use NFD as an agent for unloading of targets species and the port facilities for transhipping of by-catch.

We had 4 Taiwanese longliners coming to Noro this Friday. They announce that on Wednesday, which gave us the time to cross-check via FFA VMS their tracks and compliance index, furthermore via FIMS we can verify the whereabouts since their last port of call. As many of them are using e-reporting, we get to see how much fish they have declared, plus the EEZ where they fished, as well as the licenses they hold. 

Hence we have the tools to evaluate their activities prior arrival and approve their Port Entry and Port Use. We have been doing this with Port State Measures Agreement (PSMA) in mind, either by direct signing or perhaps via a WCPFC CMM (now that Japan, who was the main antagonist, has ratified and this is BIG news). In any case, we been doing it for a while so is up to the bosses in Honiara to decide what and when.

We have a target of 100% inspection on foreign vessels,  we suspect something from the screening, we go on board to find answers. If not (as with this 4) we go to the clearing and to crosscheck the e-log with the log sheet as well as the logsheets consistency and format, besides making sure that the vessels are the one we have tracked via the markings and the serial numbers on the gear on board. 

Jamie and John R clearing the arriving vessels

Jamie and John R clearing the arriving vessels

When (like on friday) we had 4 Longliners in a row and all of different sizes, getting to the last one can be tricky. So my full respect to Jamie and John, but especially to Nesii, there are not many young female fisheries officers that would move so at ease like her. 

Nesii makes it look easier

Nesii makes it look easier

Once is all good the vessels is cleared to unload, with they start doing immediately, mostly -35 to -50C YF. As you can see we (in this case Sandy) tally each fish individually, next to the buyer rep and the seller rep. The fish goes immediately into a -50C container that is aimed later to the Asian market. 

Sandy weighs every fish

Sandy weighs every fish

While our targets for domestic vessels could be lower, we do the same procedure (vessels VMS check, e-log and in these cases many times e-observers as well), we go on board to look for issues if any, and then clear for unloading.

Have to say that NFD vessels are the best vessels I ever work with, super straight, clean, most of them only fish in archipelagic waters and they know compliance by heart. In fact, they are the only MSC certification for tuna I have personally agreed with… but that is a thorny topic for another blog!

Here in Noro for the last 3 years now, we have accounted for every kg of each species caught by the locally flagged fleet for every individual landing and we have accounted for every kg that has been exported in any shape or form to any market, plus what goes for domestic consumption.

If it was unloaded and not processed or exported, then is here. End of story

If it was unloaded and not processed or exported, then is here. End of story

We do a "mass balance reconciliation" prior every movement of fish out of establishments here in Noro. There is no way that "fish declared in is more than fish declared out" can happen. On a weekly basis, we audit a random landing of any of the seven vessels, and we check that "fish in = fish in storage + fish out", just to make sure that we are doing the right job.

Thankfully NFD and Soltuna have the best inventory and process controls database that is have ever seen in the 52 countries I have worked so far. I have know Edmond, the database guru behind it, for years now and we have always interacted on what is expected of the system to do from the compliance side. 

Jamie is great to work with

Jamie is great to work with

We (government and industry) can track and trace fish from any landing of any locally flagged boat from the moment it was fished to the container number in which it left Noro, and/or where in the coolstore is the balance… and we can do that without anyone getting crazy… because as I said, we do it on a weekly basis.

Now back to the LL! What is not landed (target species) is transshipped (bycatch and smaller fish). Transshipping for longliners are complex events as they happen while anchored, in the port area but away from the wharf. And it gets even more complicated when we try to estimate by-catch. As said the vessels are anchored (hence they move) therefore electronic scales don't do the trick, so we have struggled to account for the by-catch. So far we did pieces counting and weight estimations, yet this Friday we manage to account species, pieces, and weights. 

With a couple of old scales I found, a couple of ropes, a well-designed checklist, lots of humour and the good will of everyone we are doing the full load (piece by piece) of the four vessels.

And incredibly an inspector of Taiwan Fisheries Agency is here (albeit quite clueless), and he really wants our info (surely the EU yellow card has nothing to do with it). Solomons helps Taiwan this time :-).

Solomons helps Taiwan

Solomons helps Taiwan

What this system now means for us here, is that we check the legality via a procedure compatible with PSMA and then account for every kg of fish that is unloaded in Noro and for every kg that leaves Noro in any form or shape and we mass balanced it. 

Which is in principle what a CDS should do, and that one is long conversation we been having. 

The fact we manage to have this here in Noro in the Solomons (with all the limitations of an LDC country) is a combination of two very straight local operations and the good will from the local officers. 

And I cannot stress how critical this is, particularly regarding having the officers committed, empowered and understanding why they are doing what they are doing. And believe me, is not their salaries… most western teenagers have more pocket money over the year. But these guys and girls here do believe in what they are doing and understand the bigger picture. Not that they or things are perfect… far from that; the office is small and stingy (we moving soon to a bigger one), the car does not work, internet is unreliable, every thing takes long time to arrive... but the officers are committed, and that is worth gold.

Lunch with the crew, they would have not invited us if they did not respect what we are doing

Lunch with the crew, they would have not invited us if they did not respect what we are doing

But I think that if you treat people with respect for their way to see things, create personal connections, do their job with them, share food, learn from them, make it two way relationship… things do happen. Whakataukī (proverbs) play a large role within Maori culture, and my favourite for years has been this one:  He aha te mea nui o te ao (What is the most important thing in the world?) He tangata, he tangata, he tangata (It is the people, it is the people, it is the people). The longer I do this job, the more it makes sense. 

I don't know if what we do here is replicable across the Pacific or even in other ports in the Solomons… but I do know that Fisheries would be in better space if we could move forwards, one Noro at the time.

My home in Noro

My home in Noro

Disclaimer
My presence here over the last 4 years has been of around 6 to 9 weeks per year, doing mentoring and thechnical gidance, either with contracts with FFA/EU or NZ Aid.

But I have been coming here since 2000 under many roles and agencies, if there was to be a 2nd home for me in the Pacific, is here in this leaf house you see, is my place here in Noro, the place that for me represents what fisheries should be in the Pacific.

Dual use of fish wells in Purse Seiners and Longliners by Francisco Blaha

A new “storm” is closing on Purse Seiners and many longliners approved by their flag states Competent Authorities (CAs) as eligible to export to the EU. It relates to using fish wells/holds to transports fuel when they depart port or after bunkering at sea.

Only for fish my friend

Only for fish my friend

If you want to understand how "eligibility" (to be authorised to export or provide to processing establishments approved to export) to the EU works, I’ll direct you un-shamelessly to this publication.

Yet as a simplification: all establishments in the capture or aquaculture production chain (hatcheries, farms, vessels, plants, cool stores, etc.) must be approved by the national Competent Authority (CA) in regard to the EU requirements for the product that they handle to be considered “eligible” for the EU.

The list of approved establishments in the progression from “raw material to product” is maintained by the CA and represents all the Food Business Operators (FBOs) in the production chain that are allowed to provide to companies that export directly to the EU.

The establishments at the end of the chain (those that export directly to the EU) are to be included on a list of establishments authorised to receive a Health Certificate for their products. This list can include freezer vessels, plants or cool stores as long as they export directly to the EU (or to another third country for further processing and then to the EU).

These establishments are given a unique identification code, usually known as the “EU number”.

The CA sends to the European Community  a “list” of authorised establishments (including freezer and factory vessels), with the guarantee that they have been inspected and deemed to comply with the specific hygiene rules that correspond to the type of product processed.

Therefore any changes or updates in this list need to be communicated to the EC immediately. The approval and listing is not a “one off” event, it is based upon continuous compliance by the establishments.

If the level of compliance becomes so low that the CA is unable to provide the required official guarantees, then the establishment can be suspended or taken out of the list.

When this happens, the establishment loses the right to export to the EU and or provide raw materials and products to “listed” establishments.

Regulation (EC) No. 853/2004, lays down specific hygiene rules on the hygiene of foodstuffs of animal origin, and Regulation. (EC) No. 854/200411, lays down specific rules for the organisation of official controls on products of animal origin intended for human consumption, and also includes the basic rules for the surveillance of food and the listing system for imports. This system includes special rules for fishing vessels, factory vessel and freezer vessels flying the flag of a third country, in order to be able to control fishery products even when caught by one flag and processed in a different country.

Now, since I remember, most Purse Seiners and Longliners from the Distant Water Fishing Nations use the fish wells as temporary fuel tanks, since that extend their range and as well they bring fuel to other vessels under the same owner or syndicate. So basically they do this pure economic reasons.

In general terms, once you emptied the fuel of the well, it gets a really good clean up, since the fish buyers would look for any issue to get down the price of fish when they get. And the minimal “sniff” of fuel would be the perfect excuse to get down the price big time.

And while most vessels never really “publicise” the practice of keeping fuel in the fish wells prior departure, they also didn't really hide it. Anyone having access to the engineers logbook would have know it.

Yet it was a good advice to close the well and pile the salt bags on top of the hatch. You don't have to be a food safety expert to know/feel that storing fuel where you store fish, may not be the best idea… would you accept that your vegies are transported in the empty fuel tanks of a truck?

In any case, the EU inspectors found out about this practice on some recent inspections. With the regs on their side, they noted that the dual use of wells (to store fuel and later, after cleaning, to freeze fishery products and store them), is not in accordance with the EU rules, in particular with:

point I.A.l. of Chapter I, Section VIII of Annex III to Regulation (EC) No 853/2004 (structural and equipment requirements for vessels);
 1. Vessels must be designed and constructed so as not to cause contamination of the products with bilge-water, sewage, smoke, fuel, oil, grease or other objectionable substances.

And II.1 (Hygiene Requirements)
When in use, the parts of vessels or containers set aside for the storage of fishery products must be kept clean and maintained in good repair and condition. In particular, they must not be contaminated by fuel or bilge water.

As well as, Point 2 of Chapter IV of Annex II to Regulation (EC) No 852/2004:
Receptacles in vehicles and/or containers are not to be used for transporting anything other than foodstuffs where this may result in contamination

The reality is that the only reason why vessels would use the fish wells as fuel tanks is based on the economics of a trip. So I was told, that if the vessels can’t get to the fishing grounds with the fuel they have, then they either need to bunker at sea or redesign their vessels with bigger fuel tanks as to get where they have to go. If they need to use fish wells as fuel tanks, then those wells would need to be just that, and no fish should go back there.

Hence, if an inspector of a Competent Authority of a country authorised to exports to the EU verify this practice, then  the fish in that well should be rejected. Furthermore if the practice continues, that vessel should be taken out of the EU approved list, hence all its production is not eligible to the EU (either directly of via any processing company that exports to the EU)

Companies, of course, are not happy, and while all sorts of actions are being proposed (i.e. cleaning plans, throw away plastic liners for the wells, increased testings, etc) these are, in the eyes of the sanitary authorities, remedial situations to a scenario that should not be happening… a fish well is a fish well, and a fuel tank is a fuel tank. End of story.

Interestingly, this issue will affect mostly flag states that massively subsidy fuel for their fleets, so I guess there is some sense of equanimity at the end.

A model for IT-based risk assessment for Vessel's Inspection by Francisco Blaha

The good people of IUU Watch presented a couple of weeks ago a post by Grant Humphries of Black Bawks Data Science that developed and algorithm aimed at vessels risk profiling. While aimed to support the EU IUU Reg. I like to see beyond that (how many non EU vessels do unload in the EU?), furthermore if it is to profile the risk of a vessel based on the data in the Catch Cert, they way things are at the present, that vessel could have unloaded months and even years ago.

Said so, I do like the design logic behind the algorithm, and I can see many uses for it at ports, particularly under the PSMA principles. Furthermore, I could see it as a way to add relevance to the Vessel Compliance Index like the one run by FFA.

I paste below the text from the IUU Watch post, as written by Grant. 

I present a sample application that shows how a relatively simple decision support tool could be built into the EU IT system referred to above, to assist in the selection of fishing vessels/seafood consignments for controls aimed at detecting illegal fishing. The example below combines the predictive power of Random Forests – a powerful machine learning algorithm – with the open source, web application builder “R Shiny”. This decision support tool allows users to select a test fishing vessel with set parameters, and predict its probability of engaging in illegal fishing. Users can also create their own series of parameters and make a prediction on the probability of a ship engaging in illegal fishing

The test application can be found at: https://blackbawks.shinyapps.io/IUUFishing/.

The code and technical details for the application/simulation are available on Github: https://github.com/Blackbawks/IllegalFishing

Development of the application

The steps involved in developing the risk management application were as follows:

Step 1: Creation of a simulated dataset of ships and characteristics with pre-set relationships between illegal fishing and our simulated predictor variables (see below table) 
Step 2: Training of the Random Forests (machine learning) algorithm
Step 3: Building of a web-based application in R Shiny that allows users to input data
Step 4: Use of the information in the trained Random Forests algorithm to predict the probability of the ship engaging in illegal fishing

In the real world, the dataset on which we would train the algorithm would be stored in a central, password and firewall protected database, which could be accessed through the web-based application.  A proposed model could look like this

Step 1: The data

The scenario in the test application has:

  • Five fictional countries: Sidonia, Avalon, Noordilund, Slagovnia, and Tortuga.
  • Five fictional owners: SparkleFish, FishRGud, KungFuFish, ScummyFishCo and FishARRRies
  • Five classes of ship (classed by length): 1 (60 – 100m), 2 (101 – 130m), 3 (131 – 170m), 4 (171 – 220m) and 5 (221 – 300m).
  • Five possible destinations of goods: LaLaLand, BetaZed, The Shire, Alpha Centauri, and Kings Landing
  • Five fish species: Raricus fishicaCommonae eatedieBillidae nyiecusDonaldus trumpfishii and Fishica maximus

I next simulated 3000 fictional ship IDs, with the assumption that the five countries have submitted all known data for their ships. These 3000 ships form the basis by which we “teach” our model (training) to “learn” the patterns / relationships.

With the 3000 ships, I created a data table with the following columns:

Screen Shot 2017-05-08 at 8.53.46 AM.png

I simulated this dataset under 10 assumptions:

  • Assumption 1) The largest (class 5) and smallest (class 1) vessels are slightly more likely to engage in illegal fishing. (Note: this helps to create a bimodal distribution of the ship sizes engaging in illegal activities to demonstrate the non-parametric nature of the algorithm, i.e. doesn’t depend on statistical distributions).
  • Assumption 2) “Responsible” countries with strong Illegal fishing laws are less likely to engage in illegal fishing. In our dataset, Sidonia and Noordilund are countries with strong regulations, Avalon is in the middle and Slagovnia and Tortuga have either little or no regulation.
  • Assumption 3) Companies with sustainable practices will almost never engage in illegal fisheries. In our example, SparkleFish, and KungFuFish are the most sustainable, FishRGud are moderate, while ScummyFishCo and FishARRRies are the least sustainable.
  • Assumption 4) Older fishing vessels are more likely to engage in illegal fisheries as they are more likely to be used by organizations wanting to cut costs and not prioritize safety features to save money (these are organizations likely to be more corrupt).
  • Assumption 5) Raricus fishica is likely to be illegally caught the most… but Billidae nyiecus looks like another species therefore we score it higher as there could be illegal fishing associated with it.
  • Assumption 6) CITES listed II species are more likely to be associated with illegal fishing
  • Assumption 7) If an owner has been flagged for illegal fishing in the past, this increases the likelihood a vessel is fishing illegally
  • Assumption 8) If a country has been flagged for illegal fishing in the past, illegal fishing is more likely
  • Assumption 9) If a ship has switched its trade route, it is more likely to be fishing illegally
  • Assumption 10) If ship has not switched on its AIS, it is more likely to be fishing illegally

Step 2: The analysis

Note: in this case, I was not interested in testing the hyperparameters (e.g. all the settings that help tune the algorithm) of Random Forest, so I left these under the default settings. 

Random Forests works by way of decision trees (i.e. a souped-up series of conditional “if” / “then” statements) to make predictions on a target variable. It creates those conditional statements by “learning” the relationships between the target variable (here, illegal fishing) and the predictor variables (the variables we want to use to predict the target – see table above).  Using the data simulated in Step 1, we used the “Illegal” column as our target variable – in other words, we were interested in predicting if a ship was engaged in illegal activity based on the other columns (owner, country, etc…).

We used a cross-validation technique to ensure the model was predicting our data well.  In this case, the Random Forests model we used had an accuracy of 74% – that means that it correctly guessed if a ship was engaged in illegal fishing (or not), 74% of the time. This value could be vastly improved through tuning of the model (e.g. tuning of hyperparameters, use of ensemble models, deep learning methodology, or other techniques).  I purposefully programmed “noise” in our dataset to ensure that we didn’t achieve a perfect model. The goal of this is to demonstrate how the proposed system could work as opposed to perfecting the model.

Step 3: User input and prediction

On the front end, the user is given the option to select from one of five ships, which fills in the pertinent data like “owner”, “country”, “ship length”, etc…  For example, the “Christian Bale” is a ship owned by ScummyFishCo, and is registered in Slogovnia. It is 192m long, making her a class 4 ship. The ship was built in 1975, and normally sends product to LaLaLand.  If that ship comes into port and the user tells the front end that this ship was catching Raricus fishica, that the shipment is being sent to King’s Landing, and that the AIS was active since last at port, we find that the probability of this ship engaging in illegal fishing was 0.93 – in this case, we would likely board the ship for inspection.

Another potential ship a user could pick in our application is the Bruce Lee. She is owned by KungFuFish and registered in Noordilund. The ship is 83m long, making her a class 1, and was built in 2014, normally shipping to LaLaLand.  If on an excursion, the Bruce Lee returns with Commonae eatedie being shipped to LaLaLand, and had her AIS on, the probability of the ship engaging in illegal fishing would be 0.03 (3%), so we would not likely inspect the ship so thoroughly.

Step 4: Using the information

The question really lies in what thresholds do we use to make the decision on whether to inspect a ship or not. For example, if the probability is 51%, do we board?  The precautionary principle would suggest we do, but this could increase the number of inspections which may not be commercially viable.  One school of thought could be to only inspect ships with a very high likelihood of engaging in illegal fishing (e.g. 80% or more).

No matter what approach is taken, decision support tools that take advantage of sophisticated algorithms are showing great promise. Using them to combat illegal fishing will automate decision-making in a transparent way that can be scaled from local to global solutions. Furthermore, data integrity can be secured through centralized databases with specifically designed access.

There is still much work to be done to develop these tools in a way that is agreed upon by the global community, but we are at a stage now to begin the process.

Back to Noro in the Solomons Islands by Francisco Blaha

I like my job (even if some days I don't like working) and going back to Noro (the place that to me exemplifies what fishing should be in the Pacific) makes me happy.

Not a bad view to wake up for 3 weeks :-)

Not a bad view to wake up for 3 weeks :-)

I'll be there to assist the Ministry of Fisheries and Marine Resources (MFMR), through the Mekem Strong Solomon Islands Fisheries (MSSIF) a NZAID funded initiative.

This consultancy is to follow up on initial training conducted in 2016 for the Noro based Compliance team in their day to day activities to build their capacity to confidently and effectively implement their roles, particularly in relation to CDS and CCS. I will contribute to implementing the capacity development road map for the Noro based compliance team. 

Particularly help them identify problems and unresolved issues and work with each of them to problem solve and build problem-solving skills. 

I'm going to a friend's place... (that is what it feels) and is a friend I have known from many years now, and I see growing in confidence and determination. 

50-60% chance of El Niño later this year by Francisco Blaha

There is a 50-60% chance of an El Niño event forming in middle to late 2017, according to a new Update from the World Meteorological Organization. Following borderline weak La Niña/cool-neutral conditions during the second half of 2016, sea surface temperatures and most atmospheric fields returned to more ENSO-neutral levels in January 2017 that continued to the present.

from the MetOffice 

from the MetOffice 

However, sea surface temperatures in the far eastern tropical Pacific Ocean increased to 2.0° Celsius or more above average during February and March, creating very heavy rainfall and a trade wind collapse from the Galapagos Islands to the coasts of Ecuador and Peru. This localised warming – known in Peru as a “coastal El Niño” - is different from the more broadly known El Niño warming pattern, but its impacts on the affected areas were just as big.

Many of the climate models surveyed indicate that basin-wide neutral conditions will persist through to June 2017. The subsequent development of an El Niño during the second half of 2017 is more likely than the continuation of neutral conditions. The emergence of La Niña appears very unlikely, according to the Update, which is a consensus-based product, based on contributions from leading centres around the world that monitor and predict this phenomenon, and expert assessment of the results of climate models.

It should be kept in mind that predictions of ENSO made before May or June for the second half of the year typically have less certainty than outlooks made later in the year.

Normally with El Niño stocks will move towards the east further into Kiribati, Tuvalu, Tokelau and Nauru, as water temperatures changes, and therefore away from fishing grounds of Papua New Guinea, Solomon Islands and Palau.

These changes the logistics of tuna trade since it moves transhipments to the reef lagoons of Tarawa and Kirimati and away from Majuro, Pohnpei and Rabaul. It also diverts processing towards Manta in Ecuador, as the most eastern grounds are at this stage closer to Ecuador than to Thailand or the Philipines.

The effects on regional climate of each El Niño event are never exactly the same: they depend on the intensity of the event, the time of year when it develops and the interaction with other climate patterns.

Below and explanation how the 2015-16 impacted global weather.

Background notes

El Niño is often associated with warm and dry conditions in southern and eastern inland areas of Australia, as well as Indonesia, the Philippines, Malaysia and central Pacific islands. During the northern hemisphere summer season, the Indian monsoon rainfall generally tends to be less than normal. In the northern hemisphere winter, drier than normal conditions are typically observed over south-eastern Africa and northern Brazil.

Wetter than normal conditions are typically observed along the Gulf Coast of the United States, the west coast of tropical South America (Colombia, Ecuador and Peru) and from southern Brazil to central Argentina. Parts of eastern Africa (Kenya, Uganda) also usually receive above-normal rainfall. El Niño is associated with milder winters in north-western Canada and Alaska due to fewer cold air surges from the Arctic – a result of a large-scale region of lower pressure centred on the Gulf of Alaska/North Pacific Ocean.

World Tuna Day - My take by Francisco Blaha

Until now 2 of May was quite a sombre day in my life for something that happened exactly 35 years ago, and I guess among many other things made me very aware of the rights of coastal states (and the fragility of life, the stupidity of wars, etc., etc.). Is totally coincidental (but very appropriate for my life) that the UN General Assembly proclaimed 2 May World Tuna Day, spotlighting the vital socioeconomic importance of tuna around the world. 

More than just a fish to me.

More than just a fish to me.

And yes, I’m one among the estimated 22000 people in the Pacific whose livelihoods depend directly and completely of Tuna. An industry that at its base produces some 256 million cases of tuna that are consumed annually, amounting to U$D 7.5 billion, yet around only 600 to 700 million come back to the resources owners, the Pacific Island Countries (PICs) where over 60% of the world tuna resources originate. 

Tuna has served as an important source of food for people across the Pacific islands for centuries.  However, there are serious challenges to their long-term sustainability, as there is more fishing effort for tuna than for any other group of fish, and the overwhelming majority of this effort is by Distant Water Fishing Nations (DWFN). 

And this is an issue of overarching importance since confronting interests are pushing tuna sustainability. There is a fundamental (and perhaps unbridgeable) difference; as clearly expressed to me, by my Nauruan friend and colleague Monte Depaune last year:

“for non PICs and DWFNs the issue of sustainability is one of long-term financial benefit. However, for Coastal States PICs it is also a food security issue, one that DWFNs have less trouble with, as they can leave… but PICs cannot”. 

Tuna is the lifeline of the Pacific but the balance of benefits is entirely skewed, in a way that has not moved far from the times of colonialism. 

Countries with money, technology and resources get richer by using the resources of poorer smaller countries at a lower level of development. They do so by pushing many agendas (including aid) and taking advantage of the lesser level of institutional maturity in countries that are struggling to manage themselves, as they are only 40 to 50 years old and had to “learn” from scratch a system of laws and a concept of nationhood entirely foreign to their former reality.

Tuna users in the big background boats... tuna owners in the canoe... this is just wrong.

Tuna users in the big background boats... tuna owners in the canoe... this is just wrong.

Tuna gave me a new and good life when I came to the Pacific, escaping far from my origins and struggles. Yet it gave me a life in a place whose people draws many similarities with the people I grow up in the backwaters of northern Argentina . Tuna gave me friends and an extended family in places that barely figure in maps, yet there is more “humanity” than in countries whose “empires” cover the earth.

I can only say “thank you” to tuna, and believe me that if there were any way in which I could avoid killing them, I would be first on the line. For now, the best I can aspire is that their deaths are maintained at the minimum necessary, under the terms of the law and entirely accounted for. 

I owe to myself... perhaps compensating for the unnecessary deaths I could not stop.

Closing the High Seas by Francisco Blaha

The High Seas (a.k.a. ABNJ) is a topic I have boarded a few times in the past, and is part of my ever expanding "interest list". A good discussion on “Closing the High Seas” was posted by the CFOOD (Collaborative for Food from Our Oceans Data) page.  CFOOD are the loose network of scientists who work together to better understand the science of fisheries sustainability, The group includes some heavy weight scientists like Ray Hilborn, Kevern Cochrane (former FAO colleague), Ana Parma and others.

lost in time, space and control

lost in time, space and control

I have shared CFOOD work before, as it is always thought provoking and in some cases quite controversial. Controversy and critical thinking are vital in fisheries, where uncertainty is a tool, not an excuse.

The discussion collected opinions of diverse range of people that is really experienced including some I know personally and respect a lot, like Sydney Holt, John Hampton, Bubba Cook and Petri Suuronen

The discussion ins centered around 4 areas:

  1. Should we close the high seas to fishing?
  2. Motivations for closing the high seas
  3. Closing the high seas – potential implications and outcomes
  4. Alternatives to closing the high seas – other potential strategies and outcomes

I let you read the discussion by your self by clicking on the links above, I just quote the closing comments;

Resolving the issue of whether or not to close the high seas to fishing is mostly about politics. To quote Otto van Bismarck, “politics is the art of the possible.” “Any advancements here will involve that art and not just science,” says George Rose. “I believe that a complete closure is not possible, and in some cases where reasonable management is in place not advisable, for the many reasons stated in the comments.
Nonetheless, there are many ocean areas where a moratorium as suggested by Holt makes sense – at a minimum to draw attention to uncontrolled fisheries and lack of any science or even basic information. This approach would rely on spatially based categorization of the HS into management areas, much as suggested by Chris Costello, with some areas having controlled fishing with gear restrictions and others with no fishing (I see no future in an open category except as a throw-away).
Having fishing industry involved in this would be necessary for this to have any chance of being effective. There are examples of this approach that have been very effective at smaller coastal scales.
Accomplishing this would be difficult enough politically and involve a major international effort but setting complete closure goals that are impossible to achieve and of questionable merit only muddies the waters.
how can you close so much space?

how can you close so much space?

SPC's 11th Fisheries Data Workshop by Francisco Blaha

2017 marks the 11th annual Tuna Data Workshop, and it is held from the 24th to the 28th of April 2017, in Noumea, New Caledonia. The regional Tuna Data Workshop is conducted on an annual basis for SPC member countries to improve their scientific tuna monitoring and data management capacity and satisfy their data reporting obligations to the Western and Central Pacific Fisheries Commission (WCPFC). 

Data management in fisheries (at this level) is unfortunately an indoor activity.

Data management in fisheries (at this level) is unfortunately an indoor activity.

Data acquisition and management are essential to successful fisheries management, and a lot of effort has been provided by SPC over the years to strengthen their capabilities and to support member countries in collecting and managing fisheries data, for their own and for regional benefit.  (See here what are the roles of SPC and FFA in these aspects). 

For the last years, I been working on the use of these (SPC's and FIMS) data streams in MCS to control IUU fishing and "fish laundering", hence I very grateful to SPC and FFA to have invited me to assist to the present workshop as to strengthen my knowledge in these areas and offer a glimpse of what I'm working on for FFA.

Very much looking forwards to this week, besides work New Caledonia being a small piece of France in the Pacific they take their coffee, their bread and their fitness quite seriously... and I'm quite partial to that!


Benefits of a moratorium on transshipment on the high seas by Francisco Blaha

Transhipments is a complicated issue I boarded (pun intended) before. While there are valid logistical and economic reasons for their existence, they remind a problematic issue and all efforts to control them seem to fail short. To the recent study on likely transhipments I posted a week ago, this new paper on Marine Policy adds more salt to a already known injury, and makes a good case for a total ban on transshipment at-sea across all RFMOs.

Yellow: ORION S (reefer), Blue: AMERICAN EAGLE (purse seiner), both Colombian flagged, transhipping in the High seas between Ecuador and Galapagos Islands.  2015-04-09. Image source Global Fishing Watch

Yellow: ORION S (reefer), Blue: AMERICAN EAGLE (purse seiner), both Colombian flagged, transhipping in the High seas between Ecuador and Galapagos Islands.  2015-04-09. Image source Global Fishing Watch

The six authors of this paper come from a mixture of academia and NGOs, wich is good to see as (in my opinion) some NGOs tend to be weak on the factual analysis side, while academics (in principle) go trough a more rigorous process on their publications. The paper does not tell "unknown" truths to the people in the IUU field, but grounds those truths on a solid methodological review of the rules at RFMOs and from those, they draw some robust conclusions that go beyond fisheries.

I paste below the abstract and conclusions, but as usual, go to to the original for the full picture.

Abstract
One way that illegal, unreported, and unregulated (IUU) fish catch is laundered into the seafood market is through transshipments at-sea. This practice, which often occurs on the high seas (the areas of ocean beyond national jurisdiction), allows vessels fishing illegally to evade most monitoring and enforcement measures, offload their cargo, and resume fishing without returning to port. At the same time, transshipment at-sea can facilitate trafficking and exploitation of workers who are trapped and abused on fishing vessels.

This study gives an overview of high seas transshipment as well as evaluates transshipment at-sea regulations across 17 Regional Fisheries Management Organizations (RFMOs), which are responsible for regulating fisheries on the high seas. Transshipment at-sea regulations have become increasingly strict in most RFMOs since the late 1990s. However, only five RFMOs have mandated a partial ban, and only a single RFMO, the South East Atlantic Fisheries Organization (SEAFO), has mandated a total ban on transshipment at-sea.

A total ban on transshipment at-sea across all RFMOs would support the ability of oversight and enforcement agencies to detect and prevent IUU fishing and also likely reduce human trafficking and forced labor on the high seas.

Conclusion
The RFMOs around the world are in a unique position with respect to transshipment, and are likely to come under increasing pressure to address this activity for both ecological and sociological reasons. Given the increased overexploitation of high seas fish, sizable economic losses to illegal fishing globally, documented IUU fishing associated with transshipments on the high seas, and ever-increasing concerns about forced labor, it would be prudent to invoke the precautionary principle and instate a moratorium on transshipment at-sea across all RFMOs.

While most RFMOs have improved transshipment at-sea regulations over the last two decades, a moratorium on transshipment at-sea would provide the best ecological and social outcome for high seas fisheries. A total ban on transshipment at-sea is a primary way to ensure that human trafficking can be combated alongside preventing the laundering of IUU catch.

The socioeconomic effects of an RFMO-wide moratorium would likely be fairly immediate, as vessels would be routed into EEZs and return to port more frequently, which would likely increase the costs of fishing but also improve trafficked fishers’ opportunities of notifying authorities of human rights abuses. Ecological effects, however, would likely only become apparent over time, if the moratorium on transshipment reduced overfishing and IUU fishing.

Reduced fishing pressure on the high seas could also offset economic losses of a ban on transshipment at-sea if fishing within EEZs subsequently becomes more productive. RFMOs might adopt a precautionary approach similar to SEAFO's, which included an interim prohibition on transshipment at-sea before implementing a permanent ban.

The issue of IUU fishing and human rights abuses on the high seas deserve urgent attention, and a moratorium on transshipment on the high seas is one way to address both issues.


A database of global marine commercial, small-scale, illegal and unreported fisheries catch 1950–2014 by Francisco Blaha

I wish I had more time to read, or more validly, I was more disciplined in my job to allow reading time! Yet again a recent paper by Reg A. Watson caught my attention. In this latest work, he harmonised global fisheries landing datasets from the best public sources, interpolate missing taxonomic data, then map the records to a grid of 30-min spatial cells so as to remain consistent with all available auxiliary data and make that dataset publically available. What a legend!

Examples of database use with mapped catch rates (kg km−2 yr−1).(a) Average annual reported catch rates (including IUU) for 2010–2014; (b) Average annual catch rate of discarded marine products 2000–2004; (c) Average catch rate of sharks and rays 20…

Examples of database use with mapped catch rates (kg km−2 yr−1).
(a) Average annual reported catch rates (including IUU) for 2010–2014; (b) Average annual catch rate of discarded marine products 2000–2004; (c) Average catch rate of sharks and rays 2010–2014; (d) Average catch rate of tunas and billfish 2010–2014.

Read below my shameless quoting of his paper or go (for free) to the original.

Abstract
As Global fisheries landings data from a range of public sources was harmonised and mapped to 30-min spatial cells based on the distribution of the reported taxa and the fishing fleets involved. This data was extended to include the associated fishing gear used, as well as estimates of illegal, unregulated and unreported catch (IUU) and discards at sea. Expressed as catch rates, these results also separated small-scale fisheries from other fishing operations. The dataset covers 1950 to 2014 inclusive.

Mapped catch allows study of the impacts of fisheries on habitats and fauna, on overlap with the diets of marine birds and mammals, and on the related use of fuels and release of greenhouse gases. The fine-scale spatial data can be aggregated to the exclusive economic zone claims of countries and will allow study of the value of landed marine products to their economies and food security, and to those of their trading partners.

Background & Summary
Fishing operations span the globe and occur in all but the deepest and most remote places in global oceans. Fishing remains central to the food security of many countries. It provides much needed protein and income to those with few alternatives. To wealthier nations it is associated with an extremely valuable and a highly globalised seafood trade. The world’s oceans hold continued promise to provide a range of vital services, and fishing will remain important.

Conflict for coastal land use, pollution and other increasing population-based demands are compounded by ocean acidification, warming, spread of pests, deoxygenation and toxic algae blooms. Humans need to guard marine resources, and mapping global fisheries is an important element. Fishing effort continues to increase, putting pressure on marine resources. Large ocean areas have been set aside from fishing as marine protected areas but placing these also requires knowledge of fishing pattern. Knowing the details of global fishing operations remains an important part of ensuring that the ocean’s services and productivity are not misused.

Examining the relationship between global fisheries and the marine environment, including its wildlife and sensitive habitats is challenging but is necessary before the impact on biodiversity and its values can be estimated. Publically available fisheries records are vague, especially in locating where fishing occurs. Nevertheless, it is vital to map fishing and use all available information to do so.

This information includes all public sources covering various spatial scales, and auxiliary data such as the distribution of the reported taxa, and information on the distribution of fishing fleets based on access rights and on their observed behaviour. Datasets have been compiled with increasing skill since 1999 and are renewed as more data become available.

The approach here is to use a harmonised global dataset from the best public sources, interpolate missing taxonomic data, then map the records to a grid of 30-min spatial cells so as to remain consistent with all available auxiliary data and to make that dataset publically available (Data Citation 1: Institute for Marine and Antarctic Studies, University of Tasmania http://dx.doi.org/10.4226/77/58293083b0515).

Data was sourced from a range of public sources (Fig. 1).

Fig 1: Flow diagram of data collation and processing

Fig 1: Flow diagram of data collation and processing

These were harmonised into a single global dataset with common coding. For each location and year, the best coverage from the available sources was selected and overlapping data removed. This dataset was filtered to retain only marine animals but excludes amphibians, reptiles, birds and mammals.

The records were mapped to candidate cells within a system of nearly 300 k global 30-min spatial cells using information on the reported fished taxon’s distribution, the behaviour and access of the reported fishing fleets and any area description provided. A portion of the reported landings represented by each record of the unmapped global dataset was mapped to each candidate cell following a gradient based on the reported taxon’s expected distribution based on depth, habitat and other requirements. Known quotas imposed on fishing fleets were applied.

The result was a mapped dataset of catch rates (tonnes per square km of ocean) for each spatial cell separated by year, fishing nation and fished taxa. This data set was further extended to breakdown the reported landings by fishing gear type based on associations with year/country/taxa. Following this, the catch rate of illegal and unreported landings was estimated for each data record. An estimate of discards (not necessarily of the reported taxa) is also made. Though much of the input landings would be derived from large-scale fishing operations it was possible to estimate rates from small-scale fishing and adjust catch rates to minimise duplicate reporting.

Non-overlapping data sources are selected as input (Fig. 2a). In general, the United Nation’s Food and Agriculture’s (FAO) dataset was the only source that provides global coverage but spatial resolution can be quite coarse. FAO’s various regional bodies provide finer spatial definition for several areas and those were used when available and possible. The breakdown of global tonnage represented by records (Fig. 2b) correlates generally to those developed by reconstructions of individual countries in another global dataset (SAUP), which uses different methodology. The number of database records varies spatially (Fig. 2c) and was impacted by the diversity and intensity of fishing and the level of management control. The number of different taxa reported also varies and is greater in coastal areas (Fig. 2d).

One of the likely conclusion of this mammoth dataset, is something we all suspect, that for more than a decade catches have plateaued and we are at maximum extraction capacity. Even if fishing effort still increasing (mostly thanks to subsidies) there is no "more" fish to take... what we have now is as good as it will get... if anything it will go down.


Inroads into Ilegal transhipments analysis by Francisco Blaha

I recently reported on an interesting report on the Global Footprint of Transshipments produced by Global Fishing Watch. As is had a flight with shitty movies, I went over the methodology of the report, and I like it. Is well thought and explained.

Is a pity that these guys don't have access to RFMO and the flag state data on observers, and logsheets, and in many cases the RFMOs don't have the manpower, budget and political will by their DWF Members to get a couple of good consultants/researchers to go over the results and track back the vessels documents, wich are at the end of the day the responsibility of the flag state. (Maybe there is a space for support from big NGOs like Pew or WWF?)

For example, one of the cases they present is of 2 vessels I got to know something about.

In page 6 they present data of an encounter between the ORION S (reefer), and the AMERICAN EAGLE (purse seiner), in 2015 at the high seas (ABNJ) between Ecuador and the Galapagos Islands. Both these vessels are Colombian flagged and belong to the same company that operates a dozen purseiners from the port of Manta in Ecuador. In principle, the purseiners transship in port to the carrier, and when the carrier is full it goes to Panama, crosses the canal and comes down to unload in Cartagena.

All the vessels of this company (including the carrier) are EU listed, hence for that fish to go to the EU a catch certificate is to be validated by the Colombian Fisheries Authority (AUNAP) so in principle they should have access to the logsheets and VMS of the vessels, plus it would surprise is they were to allow transshipments at sea.

In any case, the information should be there to verify the finding, and if is not, then that is a big failure by the Authority of an allegedly responsible flag state. Otherwise, they should audit the company that owns both vessels and look for the “mates receipt” that conform the volumes transferred. No captain would ever let fish go without a receipt because his payment depends on that.

The reality is that there are records for every one of those alleged transshipments, but one need the authority, the knowledge where to look and the willingness by the flag states to do something about it.

Back to the report, I pasted below the methodology of the study so that you can assess for yourself their robustness.

Methodology

AIS Data
We identified the majority of the world’s reefers and then tracked the movements of these vessels using the Automatic Identification System (AIS), a type of transceiver that broadcasts a vessel’s location every few seconds. Originally meant for vessel collision avoidance, AIS can now be picked up by satellites and terrestrial receivers. This data is aggregated into global into global databases such as the one Global Fishing Watch obtains from the telecommunications company Orbcomm. The International Maritime Organization mandates that all vessels larger than 300 tons on international voyages carry AIS, and most countries have adopted similar or stricter regulations for their EEZs. In 2016, more than 300,000 vessels broadcasted an AIS signal, of which about 80,000 were fishing vessels, and a few hundred were refrigerated cargo vessels.

 Development of Reefer Database
Our database of reefers was compiled from the following sources:

  1. Refrigerated cargo vessels, fish carriers, and fish tender vessels were identified using vessel lists from the International Telecommunications Union and major Regional Fisheries Management Organizations (RFMO).
  2. If a vessel participated in multiple encounters with fishing vessels, we conducted a web search and reviewed RFMO registries using information from the vessel’s AIS to determine if the vessel was a reefer.
  3. Additional reefers were found by investigating documentation on registry websites and other online resources and determining alternate identities that we were able to match in our database.
  4. A vessel classification neural network, developed by Global Fishing Watch to predict vessel types based on movement patterns, was used to identify possible reefers.

Vessels that were identified as likely reefers by this neural network were manually reviewed through web searches and RFMO registries.

After developing the list, we verified vessel information using reputable online sources: the HIS shipping databases, MarineTraffic, ShipSpotting, VesselFinder, and FleetMon. Our database of reefers is now available through globalfishingwatch.org.

We identified a total of 794 reefers. According to the US Central Intelligence Agency World Factbook, 882 refrigerated cargo vessels were active worldwide in 2010.Assuming that the number of reefers has not significantly increased or decreased since 2010, our dataset includes about 90 percent of the world’s reefer vessels. Some industry analysis suggests the number of reefers is decreasing, meaning that this 90 percent figure is a conservative estimate.1 7 Almost all reefers are required to carry AIS. Ninety-eight percent of the refrigerated cargo vessels in our dataset are larger than 300 gross tons and the International Maritime Organization mandates that vessels heavier than 300 tons on international voyages carry AIS.

Most countries have similar regulations for their EEZs. If we are missing reefers in our dataset, they are likely to be either smaller reefers or vessels that do not make international voyages.

Identifying Transshipments: Encounters and Rendezvous Behavior
We identified potential and likely transshipments in two ways: vessel encounters and rendezvous behaviour by reefers. We extracted these signals using our AIS and reefer databases with help from locations of known transshipments from the Indian Ocean Tuna Commission (IOTC).

Vessel Encounters
To identify likely transhipment events, we identified all interactions between two vessels which remained within 500 meters of each other for longer than 3 hours while travelling at less than 2 knots. These parameters balance the need to detect vessel pairs nearby for extended periods of time while recognising that satellite coverage and inconsistent AIS transmission rates may limit our ability to identify long periods in which vessels are in immediate contact (see data caveats below). We filtered our results to include only events where one of the vessels was a refrigerated cargo vessel and the other a fishing vessel. This left us with 5,065 encounters between reefers and fishing vessels, or “likely transshipments,” from 2012 through 2016.

Rendezvous Behaviour by Reefers
Refrigerated cargo vessels exhibit specific rendezvous behaviours during transshipments. We identified these behaviours by analysing known, observer-reported transshipments from the Indian Ocean Tuna Commission (IOTC; 5,874 transshipments between 2009 and 2015). Through our analysis, we identified reefers that exhibited similar patterns of moving less than 2 knots for longer than 8 hours. Distinctive C-shaped tracks and abrupt shifts in course following a period of slow speeds characterised most transhipment events. Following these metrics, we analysed 117 million reefer positions from 2012 - 2016 and identified 86,490 events where a refrigerated cargo vessel exhibited these behaviours, which we identify as “potential transshipments.”

Not all of these rendezvous events are transshipments of fish. Some may represent transfers of fuel or cargo, and others may be the reefer simply waiting until it is scheduled to travel to its next location. Future research will estimate the fraction of these loitering events that are transshipments of fish. For this report, we present these events as a proxy for transhipment of fish at sea, recognising that it is not a one-to-one relationship.

Caveats
For this report, we call an event where a reefer encounters a fishing vessel a “likely transhipment” and an event where a reefer exhibits rendezvous behaviour a “potential transhipment.” Our set of “likely transshipments” is a subset of “potential transshipments.” In nearly all cases, we are not able to verify whether the transhipment actually occurs. Any reference to transshipments throughout this report is simply where we see likely or potential transhipment behaviour in our data. Also, we identified several thousand instances of reefers meeting up with non-fishing vessels, or meeting up with other reefers. For this initial report, we exclude these events, and focus only on fishing vessel-reefer encounters.

We also did not investigate transhipment between different fishing vessels.

We restricted our analysis to events occurring at least 20 nautical miles from shore to avoid capturing encounters occurring in ports. This distance is still well within the 200 nautical mile limit of EEZs. Future analysis will consider the distance from port instead of distance from shore so as to capture vessels close to shore but far from the port.

One data challenge is due to the limitations of the satellite receivers used to detect AIS signals. Satellites can fail to receive messages from fishing vessels for two reasons:

  1. High vessel density: A satellite can only record a limited number of messages at once, and when there are too many vessels beneath a satellite, some AIS signals are not recorded. As a result, in areas of high vessel density such as the South China Sea or regions off the coast of Europe, we cannot observe a vessel’s movements as accurately.
  2. Satellite coverage: Based on the number of satellites and their orbital patterns, there can be several hours a day when there is no satellite overhead to receive signals.

Fortunately, these limitations are being addressed by the launching of more satellites. In 2012, only two Orbcomm satellites, the satellite provider for Global Fishing Watch, were operating, and now 18 are in orbit. Also, these limitations do not apply along the coastlines of most developed countries, where terrestrial antennas, which are not as affected by vessel density, are present.

In addition, some vessels will not appear in the dataset for the following reasons:

  1. Vessels may intentionally turn off their AIS transmitters.
  2. Vessels may not have AIS at all. Regulations vary by country, and in international waters, vessels under 300 gross tons are not required to use AIS.
  3. AIS transmitters vary in quality, which results in patchier coverage of vessels with poorer quality hardware.
  4. Some fishing vessels use invalid Marine Mobile Service Identity (MMSI) numbers. For this analysis, we ignored these vessels, as they are difficult to identify. Doing so excluded less than one percent of our total encounters.

We have observed fishing vessels turning off their AIS in some areas of significant transhipment, including near the coast of West Africa, outside the Argentinean EEZ, and in some parts of the Indian Ocean. In future analysis, we hope to quantify this disabling of AIS and determine if it related to transhipment.

While some fishing vessels turn off their AIS from time to time, the practice is significantly more rare among reefers. We analysed all the gaps in transmission from reefers that started and ended more than 10 nautical miles from shore and lasted more than 24 hours, and found that these gaps represented only a small percentage of the total time reefers were active. We estimate that reefers in our dataset only show 24 hours or longer gaps in their track approximately 2 percent of the time while at sea. Therefore, we are confident that the AIS data for refrigerated vessels captures the majority of their footprint.

Transhipment is Most Common in the High Seas and Russian EEZ
About 43 percent of the likely and potential transhipment events happen in the high seas, with the remaining 57 percent within EEZs of different nations. About a third of the total events occur in the EEZ of Russia, where transhipment appears to be a standard part of how their fishing fleet operates. After the high seas and Russia, transhipment is most common in the EEZs of Africa and Oceania.