Recently I posted about a publication by Bob Gillett and SPC on the significance of fisheries for the Pacific. The report named Benefish, is a 630 pages book, that has a lot very good info in it. So as a lazy writer, I would quote over the next moths figures, concepts and "stuff" that I found interesting.
It is estimated the volume of all fisheries and aquaculture production in the region in the six fisheries categories (1) coastal commercial fishing, (2) coastal subsistence fishing, (3) locally-based offshore fishing, (4) foreign-based offshore fishing, (5) freshwater fishing, and (6) aquaculture for 2014 was about 2.0 million metric tonnes (mt), worth US$3.2 billion.
In comparing these figures to estimates by other studies it is important to consider carefully how the “region” is defined, and where, in the value chain the value is estimated. The present study defines the region as the 22 Pacific Island countries and territories and their 200-mile zones. The values used reflect the prices paid to the producer or (for offshore fisheries) in-zone prices.
Key features of coastal fisheries production
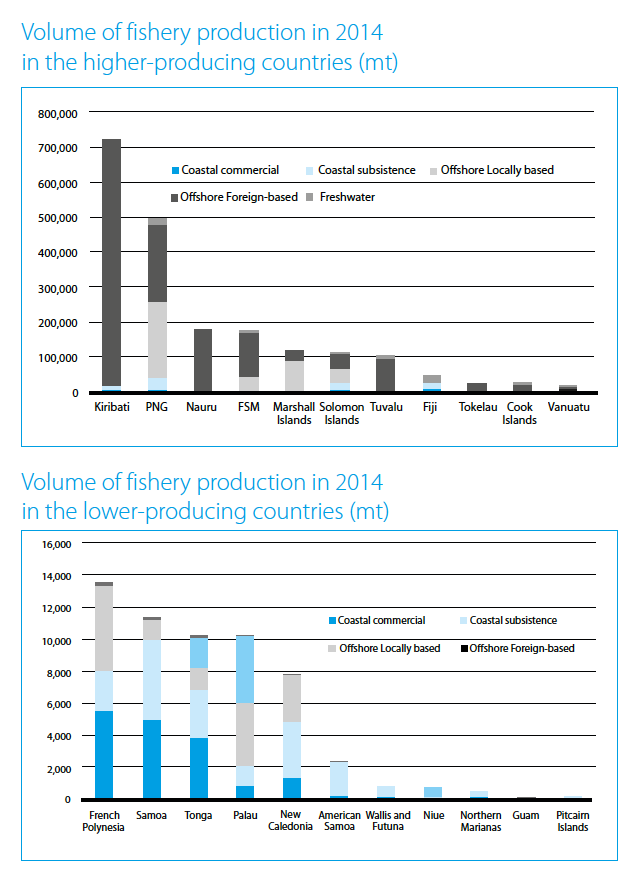
- The volume for all coastal fisheries (i.e. commercial and subsistence in Papua New Guinea (PNG) is about one-third of the regional total.
- The production from Fiji’s coastal commercial fisheries is greater than that of any other PICT, even for that of PNG, with a population almost nine times greater than Fiji’s.
- Considering the level of overall development of Samoa and Tonga, the degree of commercialisation of the coastal fisheries (reflected in their relative positions on the comparison graph) is high.
- Considering that New Caledonia and American Samoa are quite developed, the degree of commercialisation of their respective coastal fisheries (reflected in their relative positions on the comparison graph) is relatively low.
Key features of offshore fisheries production
- The value of offshore fishing in the Kiribati zone in 2014 (US$1.1 billion) approaches the combined value of offshore fishing of all other PICTs, excluding PNG (US$1.3 billion).
- The effects of the 2014 El Niño conditions on offshore fisheries production is readily apparent, and has resulted in higher catches in the central equatorial region.
- Three countries in an area of relatively productive tuna fishing had no locally based offshore fishery production (Nauru, Tuvalu and Tokelau). Kiribati had only a tiny amount of locally-based offshore fishery production.
- In about one-third of the countries that are significantly involved in offshore fisheries, the fleet is all locally based. In another third of countries the fleets are a mixture of locally and foreign-based, while the remainder have foreign-based fleets.
- Although Palau is a party to the Nauru Agreement (one of the parties to the Nauru Agreement – PNA), the production from its offshore fishing is less than that of several non-PNA countries.
Aquaculture production in the region
In 2014 aquaculture production in the region is estimated to have been 4,217 mt and 9,122,169 pieces, worth US$116,005,524. Two French territories were responsible for more than 93% of the value of all aquaculture production in the region. In only six PICTs was the value of aquaculture
production in 2014 greater that 5% of the value of coastal fisheries. All but one of those PICTs (Cook Islands) are territories.
Changes in fisheries and aquaculture production during the period 2007–2014
- In the 22 countries and territories the total volume of fishery production increased by 431,354 mt (32%).
- The value of fishery and aquaculture production increased by $738,662,323 (30.7%).
- In relative terms, the share of offshore foreign-based fishing expanded, largely at the expense of offshore locally based fishing.
- Coastal fisheries production has been largely stable, despite an increased coastal fishing effort in most PICTs in the region.
- Aquaculture decreased in value by 32.7% across the region. This was mostly attributable to the fall in the value of pearl production in Cook Islands and French Polynesia.
Some issues in measuring fisheries production in the region
The offshore fisheries statistical systems are in relatively good condition, both at a national and regional level, but the situation for coastal fisheries statistics is not nearly as good. Typically, national government fisheries agencies give a low priority to estimating the total amount of coastal catches. In some respects this situation is a tragedy. The importance of food security and the roles played by coastal fisheries are beyond dispute, but, in order to effectively safeguard the flow of food from coastal fisheries, that flow needs to be quantified: “You can manage what you can measure”. In view of the poor statistics on coastal fisheries production in most countries and territories in the region, and the potential for household income and expenditure surveys (HIES) to improve the situation, the applicability of HIES to coastal fisheries deserves more attention
Exports of fishery products
The annual value of fishery exports in 2014 is given for each country, in absolute terms and relative to all exports. The findings show that, while fishery exports represent less than 40% of the value of all national exports, in some countries they are quite large in nominal terms, for example: PNG (US$136 million), Fiji (US$58 million), Solomon Islands (US$54 million), and New Caledonia (US$22 million). American Samoa, PNG and French Polynesia have the largest value of fishery exports (the former and the latter being territories). Of the approximately US$820 million in total fishery exports from the region in 2014, about 76% is represented by these three PICTs.
Over the period 2007–2014 the total amount of fishery exports from the region fell by about 42% in real (inflation-adjusted) value. The fall in the value of canned tuna exports from American Samoa was responsible for about 37% of the total regional decline. Of the major exporting countries, only PNG and Solomon Islands increased their fishery exports in the period.
Access fees for foreign fishing
In each of the country and territory chapters of this book, information is provided on access fees received for foreign fishing, and these fees are compared with total national government revenue. In 2014 foreign fishing access generated US$349,335,572 across all 22 Pacific Island countries and territories. Given the lack of authorised foreign fishing in most territories, the US$349.3 million represents access fees generated in the independent Pacific Island countries as well as Tokelau.

Other aspects of access fees
- Four countries in the region received access fees in 2014 representing more than US$1,000 per capita.
- Kiribati, despite having one of the largest 200-mile zones in the region, had a relatively high ratio of access fees per square kilometre of zone in 2014.
- In the period 2007-2014 access fees increased in all countries that receive them.
- The countries with the largest increases in access fees were those that participate in the PNA Vessel Day Scheme (in which foreign purse seine vessels purchase fishing days from PNA countries).
- In real terms (i.e. adjusted for inflation) the region has experienced an eight-fold (848%) increase in the value of access fees in the period 1982–2014.
Significant findings
- Coastal fisheries production has not increased significantly in the 15-year period 1999–2014. This is despite indications at the national level of increasing fishing pressure. This is consistent with the thesis that the fish resources that support coastal fisheries in the region are fully or over-exploited. Because the population of the region is increasing, the per capita production of fish from coastal fisheries is decreasing, at a rate of approximately 6% in the period 2007-2014. This is a remarkable decrease in such a short period.
- Foreign-based offshore fishing continues to increase, with this fishing being responsible for almost all of the regional increase in fish catches in the period 2007-2014. This increase was mostly due to increased purse seine catches. This occurred despite the introduction of the PNA Vessel Day Scheme and the associated steep increase in access fees, which were mostly paid by the foreign purse seine fleets. The largest jump in access fees was between 2013 and 2014 (for countries where it was possible for the study to obtain access fees for both years), even though prices for skipjack (the main target of purse seining) decreased in that period. The fact that access fees increased, even though skipjack prices decreased, is a powerful argument for the effectiveness of the Vessel Day Scheme.